
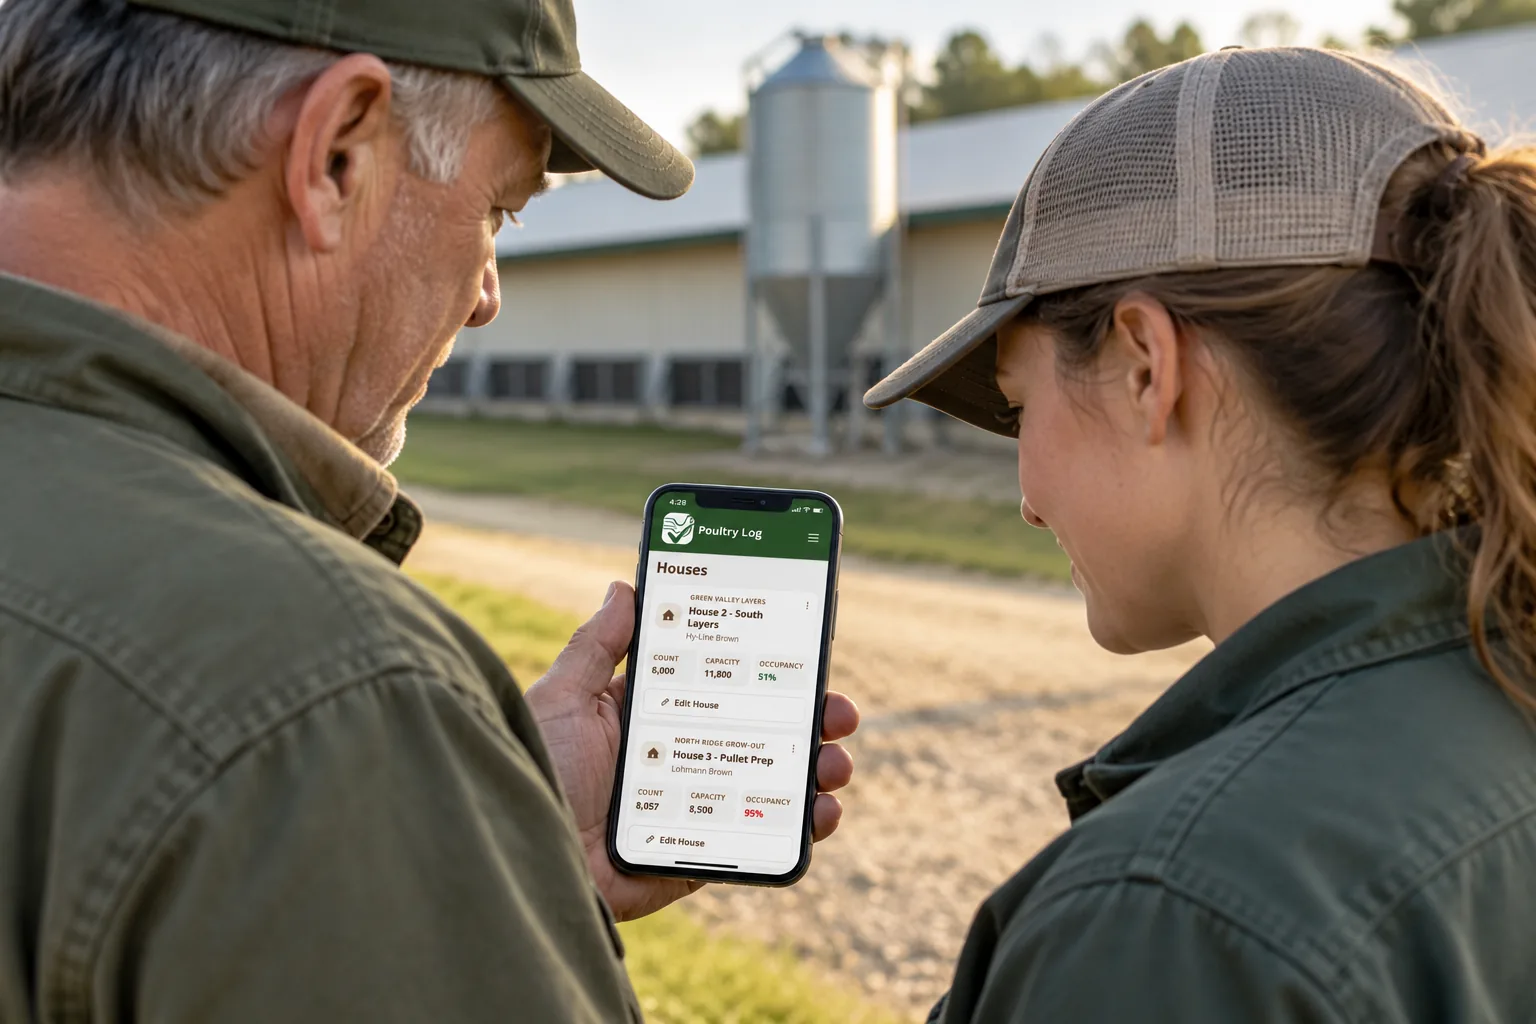
House comparison is where a multi-house operation finds its money — because the gap between the best and worst house in a flock is usually larger than the gap between a good flock and a bad one. A comparison app earns its place when it puts two or more houses on the same chart, same age, same strain, and tells you which one is drifting — before the settlement sheet averages the problem away. This page covers what house comparison demands for poultry specifically, what to verify in any app, and where PoultryLog™'s record set stands against those demands.
What Does Poultry House Comparison Demand?
| Demand | Why It Matters | What to Verify in Any App |
|---|---|---|
| Side-by-side views on one chart | Two houses under the same weather drinking differently is the fastest signal a line problem exists — separate screens make you do the comparison in your head | Request a two-house overlay for water, feed, or weights in the demo |
| Same-age, same-strain alignment | Comparing a day-21 house to a day-28 house measures calendars, not performance — the app must align by flock age | Confirm comparison uses days of age, not just calendar dates |
| Deviation identification, not just display | A chart shows the gap; an actionable comparison tells you which house is outside its own expected range | Ask how the app frames deviation — raw overlay, or flagged against targets? |
| Week-over-week comparison | The question that matters is not "which house is lower today" but "which house is falling further behind each week" | Request a two-house, multi-week view in the demo |
| Alerts when a house diverges | The value of comparison is catching the drift while it is still cheap — an alert that names the house beats a chart you remember to open | Ask whether divergence triggers an alert or waits for you to look |
What to Verify Before You Trust the Comparison
- Run the two-house drill: load two houses with real-shaped data and request the overlay — water, then weights. Time how long it takes to see the gap. If the answer is "open two exports and a spreadsheet," the app is not a comparison tool.
- Check the alignment question: confirm the app compares by days of age. A comparison that ignores age will tell you the younger house is "behind" — which is a calendar fact, not a finding.
- Verify what "deviation" means: against your own house's history, against breed targets, or just visually? Deviation against the flock's own baseline is what makes an alert actionable instead of noisy.
- Confirm the comparison survives export: house-comparison evidence feeds settlement conversations and integrator reviews — the overlay should be exportable with dates and houses intact.
Where PoultryLog™ Fits
PoultryLog™ compares houses natively: water, feed, weight samples with CV%, mortality, and daily logs charted side by side within a flock, aligned by days of age, with deviation framed against the flock's own baseline and breed targets from the growth chart curves. The processor network's benchmarking views extend the same comparison across grower networks — see grower house benchmarking for the integrator-side version. PoultryLog™ is built for commercial broilers; for honest limits and other segments, see the buyer's guide.
Where the Money Shows Up
House comparison pays where multi-house money concentrates. The spread math: if house 1 runs at breeder target and house 3 runs 8% light on 30,000 birds to 6.4 lb, that house alone carries roughly 15,400 lb of missing live weight — the growth bands guide shows how to size the shortfall. Early comparison also protects the water curve read: two houses under identical weather drinking differently is a line problem in one of them, found in hours instead of at the weekly weigh-in. And at settlement, per-house records are what turn "the flock average was fine" into a conversation about which house actually earned its keep — the comparison method applies the same discipline to the integrator's numbers.
- Poultry management software buyer's guide — parent evaluation framework.
- Broiler KPIs — the metrics worth comparing across houses.
- Water as early warning — the comparison signal that moves first.
- 2026-10-05: Comprehensive rewrite. Comparison demand table, verification drill, and honest positioning under the buyer's guide — replacing the earlier self-ranking version.
- Earlier version: "best app" ranking with unverified competitor claims.