
Every grower hits it: the weigh-in comes back light, and the question is not whether the flock is behind — it is how far behind is far enough to act. The broiler growth chart gives you the target curve. This guide turns that curve into action bands: what each deviation from target actually looks like in grams, what it costs in pounds at catch, and which response each band earns. The thresholds below use Cobb 500 targets; Ross 308 thresholds differ by a few percent — check the growth chart for your strain.
The Action Band Table
Source: bands derived from Cobb-Vantress Cobb500 Broiler Performance and Nutrition Supplement (2022) mixed-sex targets — day 14: 470 g, day 21: 975 g, day 28: 1,620 g, day 42: 2,910 g. Bands are percentages of the breeder target.
| Age | Cobb Target | On Target | Watch | Investigate | Act Today |
|---|---|---|---|---|---|
| 14 days | 470 g | ≥ 447 g | 400–446 g | 353–399 g | < 353 g |
| 21 days | 975 g | ≥ 926 g | 829–925 g | 731–828 g | < 731 g |
| 28 days | 1,620 g | ≥ 1,539 g | 1,377–1,538 g | 1,215–1,376 g | < 1,215 g |
| 42 days | 2,910 g | ≥ 2,765 g | 2,474–2,764 g | 2,183–2,473 g | < 2,183 g |
- On target (within 5%): keep the program running. Log the number and move on.
- Watch (5–15% below): the normal field band. Log it, compare against your own previous flocks, and look at the trend — a flock that sits at 10% below for two weeks in a row is different from one that just crossed into the band.
- Investigate (15–25% below): beyond what typical field results explain. Work the decision tree below this week — do not wait for the next scheduled weigh-in.
- Act today (over 25% below): something is wrong now. Sample correctly, walk the house, and treat it as an active problem with a projected revenue impact attached.
- Cobb-Vantress. Cobb500 Broiler Performance and Nutrition Supplement (2022). Download PDF
- Aviagen. Ross 308 Broiler Performance Objectives (2022). aviagen.com
What Each Band Costs at Catch
The bands matter because deviation compounds. If the cause is not corrected, the gap measured at day 28 is largely the gap you catch at — and the math is unforgiving across a full house:
- A flock 10% light at day 42 — 2,619 g instead of 2,910 g — finishes about 0.64 lb per bird light. On 30,000 birds, that is roughly 19,200 lb less delivered at catch. At an example live price of $1.00/lb, about $19,200 of revenue — before counting the feed already eaten by birds that did not gain it back.
- A flock 15% light at day 28 — 1,377 g instead of 1,620 g — is about 0.54 lb per bird behind at that moment, roughly 16,100 lb across 30,000 birds if the cause persists to catch.
- A flock in the "Act today" band at day 21 is over 240 g per bird behind the target — and at that age the flock still has time to recover part of it if the cause is corrected now. That is what the bands are for: buying back the recovery window while it exists.
Feed cost does not fall proportionally when birds gain less — the feed consumption chart shows what a bird at each age is supposed to eat, and a light bird often still eats close to that curve. Slower gain on near-normal intake is the most expensive version of "behind," and it is exactly what a persistent environment or health problem produces.
Diagnosing the Shortfall: Decision Tree
Weigh 30–50 birds per house, randomly selected, mid-morning with empty crops, on a calibrated scale — the growth chart sampling protocol. Weigh the same way you did last week. A changed method, a dirty scale, or a convenience sample of the birds nearest the door will invent a shortfall that does not exist. If this is a single house among several, compare it to its siblings under the same weather before treating it as real.
In most wide or light flocks the cause is access, not disease. Walk the house at bird height: pan fill and height, nipple pressure and height for the age, feed freshness and phase, drinker line level. Cross-check daily feed intake per bird against the feed chart and water against the water chart for the age — water dips typically show up a day or two before weight gain does.
Temperature at bird level across the house — not just at the controller. Cold corners in winter, heat load after week 3, ventilation stratification, and ammonia from wet litter all suppress gain. Heat stress is the most common mid-cycle cause: intake drops, water rises per pound gained, and ADG falls — in that order. See the ADG chart for what the weekly gain should look like at each phase.
Subclinical disease steals gain before it kills birds. Check mortality trends by house (common mortality causes), litter quality, respiratory signs, and treatments given. If the average is light and the spread is wide, calculate CV% — the uniformity guide covers targets and what a wide flock at this age signals. Access problems usually show up as both.
Confirm which strain you placed and what the placement weights were. A Ross 308 flock measured against Cobb 500 targets (or the reverse) will read "behind" by design in some weeks. A light day-old start — chick quality, transit, early access — casts a shadow the whole grow-out, and the fix is different from an acute problem in week 4.
With the cause identified, project the catch weight using the growth chart and your corrected ADG expectation from the ADG chart. Decide: correct and hold the schedule, or adjust the catch date and re-forecast settlement with the settlement calculator. The earlier this decision is made, the more of the shortfall you can still buy back.
The Recovery Window Is Real — But It Closes
Birds can recover part of an early shortfall once the cause is corrected, and they recover more of it the earlier the correction lands. A day-21 flock with an access problem fixed the same week can close much of the gap by day 35. A day-35 flock with the same problem discovered at day 42 has days, not weeks, and the FCR penalty of the finisher phase works against you while you wait. This is why the bands on this page escalate action by age: the same 15% deviation earns a same-week investigation at day 21 and a same-day response at day 42.
The other honest note: a flock that has been 10% below target since day 7 — a light placement or an early brooding problem — may simply be a flock that will finish 10% below. Fighting that with later catch dates usually costs more feed than the extra pounds return. Know which situation you are in before you spend money closing a gap that was set in week one.
Tracking Bands in Poultry Log
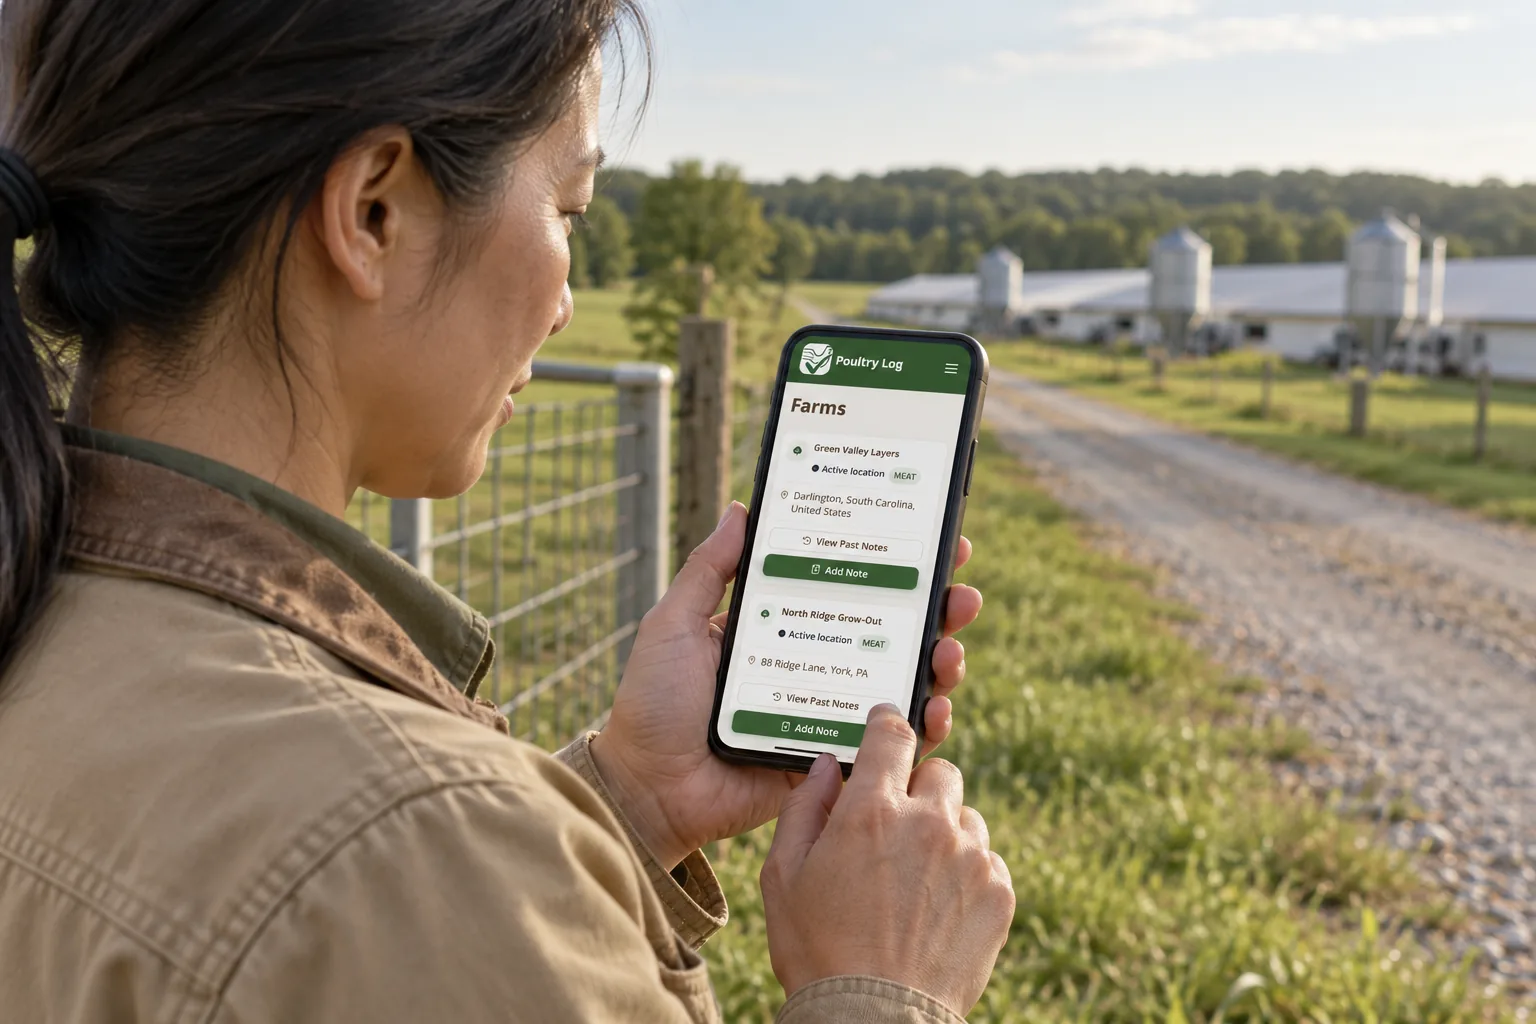
When weekly sample weights are logged per house in Poultry Log, each weighing is compared against the target curve for your breed and age — so the band you are in surfaces automatically, with the house and date attached, instead of being calculated from memory on weigh-in morning. The CV% from the same samples tells you whether the shortfall is a whole-flock shift or a spread problem, and feed, water, and mortality logs on the same timeline are what turn "behind target" into a cause you can name.
Each flock's deviation history feeds the profitability dashboard, where you can see what past bands actually cost at settlement — the record that turns this guide from a table into a decision you have made before.
- 2026-10-05: Initial version. Action bands derived from 2022 breeder targets, shortfall-to-pounds math, diagnosis decision tree, and recovery-window guidance.