

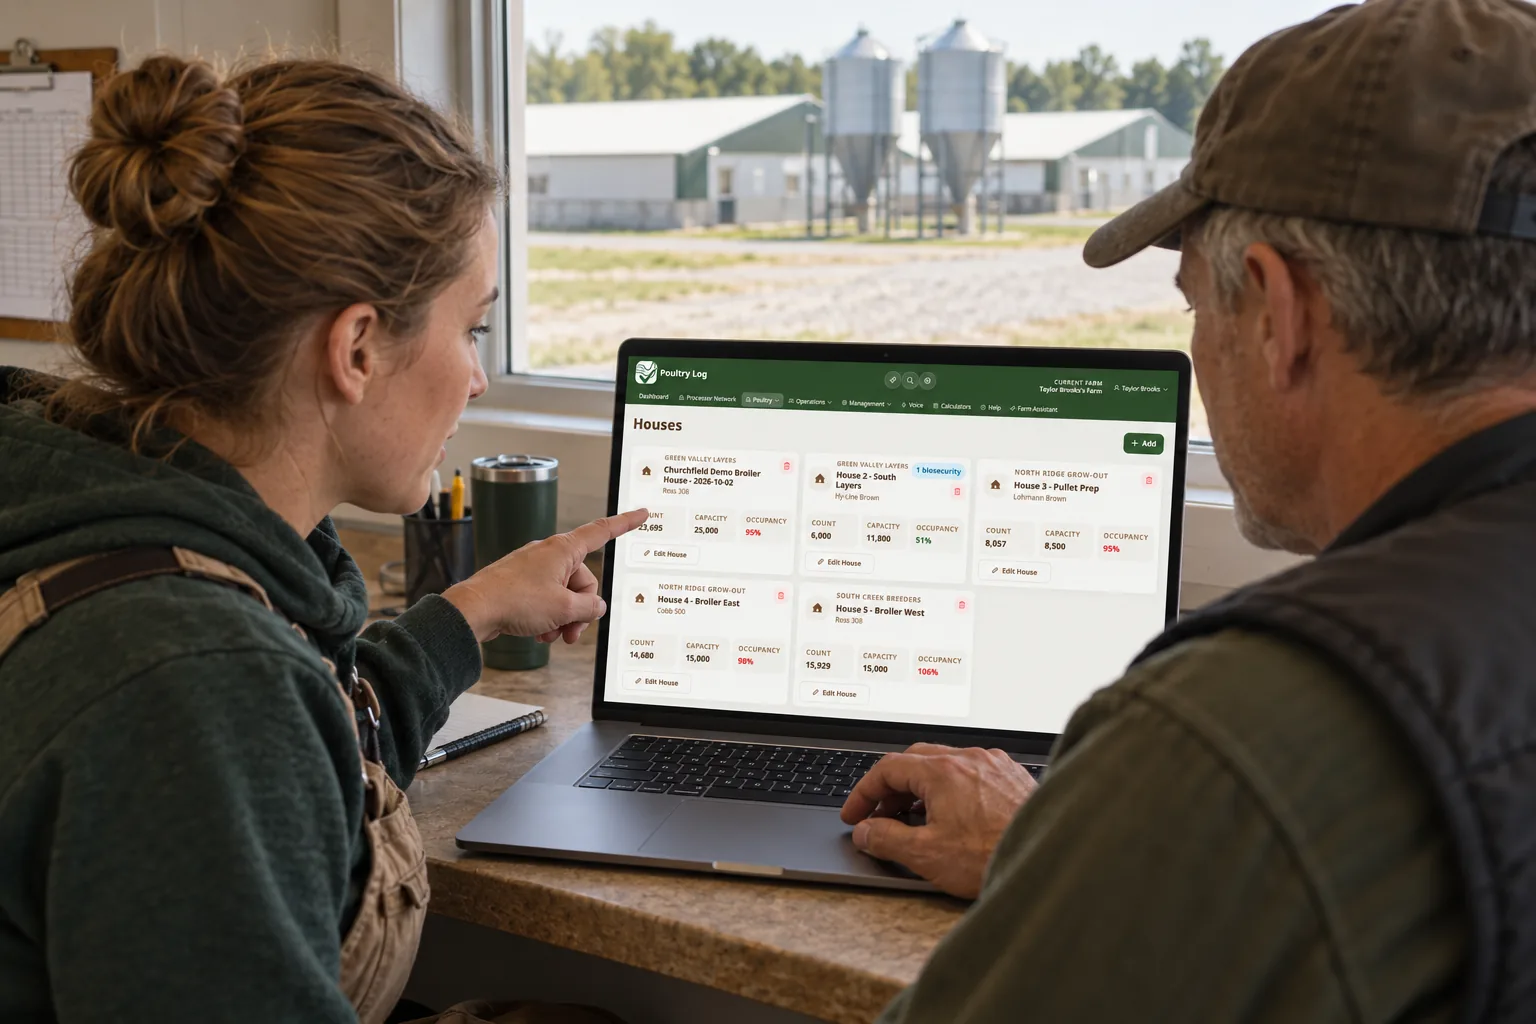
Two growers can receive the same chicks, the same feed program, and the same weather, and still produce different mortality curves and different water bills. A poultry integrator who can see house-by-house performance across the whole grower network finds that gap early instead of at settlement.
The House Benchmarking and Week-over-Week views in the Poultry Log processor console are built for exactly that comparison: mortality rate, cull rate, water use, and weight against target, house by house and week by week, across every consented grower.
What House Benchmarking Shows
For each house in the network, the console reports capacity, current flock name and age, initial and current bird counts, mortality rate, cull rate, average daily water in liters, water per bird in milliliters, compliance record count, and last log date. Mortality rate is computed from the losses recorded for the active flock, not from bird-count deltas, which keeps the number honest when birds move between counts.
Each house carries a benchmark status and findings drawn from the processor's own threshold policy. Houses can be sorted by flock age, current count, or mortality rate, viewed as cards or as a table, and selected for side-by-side comparison.
What Week-over-Week Adds
The Week-over-Week view covers flock weeks one through ten. It shows how many flocks are reporting, how many records were submitted, target versus actual weight in grams, average mortality percentage, average water use with liters converted from whatever unit the grower logged, equipment pass rate, and rodent incident rate. Multi-grower line and bar charts make it possible to see whether a network-level problem is one farm or a trend, and whether a given week's numbers are movement in rates or just movement in totals.
Threshold Policy Is the Processor's Call
Benchmarking without a policy is just a leaderboard. In the Admin Team tab, the processor sets warning and critical limits for mortality, culls, and water use, per day, per week, and per flock, plus rise and drop percentage limits for trend-based checks. Water thresholds can be expressed as minimum and maximum milliliters per bird. Those settings drive the findings on the benchmarking view and the alert stream, so the network's definition of "off track" is explicit and adjustable.
Why This Matters for Payout Economics
Mortality and feed conversion are where contract grower margin is won or lost. An integrator who sees that House 4 runs two points above the network mortality average in week six has a conversation worth having before the flock closes. A grower who sees the same comparison from their own Poultry Log dashboard can act on it too, because the records powering the processor view are the same records sitting in the grower's app. That shared source is what keeps the settlement conversation from becoming an argument about whose spreadsheet is right.
Where Poultry Log Fits
Poultry Log is where the house-level numbers come from, so processor benchmarking does not require a separate reporting project from the grower. For the grower-side view of the same idea, see the poultry farm benchmark comparison guide and the best poultry app for house comparison. Load one house and watch the profit picture fill in at poultrylog.com.
Frequently Asked Questions
How do poultry integrators compare grower performance?
By aggregating house-level records into one console. The Poultry Log processor network benchmarks mortality rate, cull rate, daily water use, water per bird, and weight against target for every house in the network, with threshold findings set by the processor.
What is a mortality rate benchmark in poultry?
A mortality rate benchmark compares the losses recorded for a flock against the processor's own warning and critical limits, by day, week, or full flock period. In the Poultry Log console, the rate is computed from recorded losses for the active flock and shown with the previous period for trend context.
Can a processor set different limits for different flock weeks?
Yes. Thresholds in the processor console are configured per metric and per period type, including day, week, and flock limits, with separate warning and critical levels and optional rise or drop percentage checks.