
Water is the earliest warning system in a broiler house. Birds stop drinking hours before they stop eating, and they stop eating days before anything visible shows in the flock. This chart gives you the expected daily water intake per bird by week for Cobb 500 and Ross 308, how temperature moves the number, and what to check when a house reads light — because a 10% water drop caught on day 12 is a very different problem than the same drop caught on day 25.
Cobb 500 Daily Water Consumption Chart
Source: water-to-feed ratio from Cobb-Vantress Cobb500 Broiler Management Guide; feed intake derived from Cobb500 Broiler Performance and Nutrition Supplement (2022). Mixed-sex birds under standard management.
| Week | Age | Water/Bird/Day at 70°F | Water/Bird/Day at 80°F | Water/Bird/Day at 90°F | House Water/Day at 70°F | House Water/Day at 70°F |
|---|---|---|---|---|---|---|
| 1 | 7 days | 30 mL | 38 mL | 45 mL | 900 L | 238 gal |
| 2 | 14 days | 78 mL | 98 mL | 117 mL | 2,340 L | 618 gal |
| 3 | 21 days | 157 mL | 196 mL | 235 mL | 4,710 L | 1,244 gal |
| 4 | 28 days | 219 mL | 274 mL | 329 mL | 6,570 L | 1,736 gal |
| 5 | 35 days | 267 mL | 334 mL | 401 mL | 8,010 L | 2,116 gal |
| 6 | 42 days | 357 mL | 446 mL | 536 mL | 10,710 L | 2,829 gal |
| 7 | 49 days | 232 mL | 290 mL | 348 mL | 6,960 L | 1,839 gal |
Week 7 runs light for the same reason feed does — breeder tables show sharply reduced intake from day 42 to 49, and most contracts catch birds at 42–45 days. House figures use a 30,000-bird placement. Expect field results in the range of roughly 250–350 mL per bird per day for market-age birds at moderate temperature; the breeder-derived figures above are the planning target, and your own logged baseline is the operating standard.
Ross 308 Daily Water Consumption Chart
Source: water-to-feed ratio from Aviagen Ross 308 Management Handbook; feed intake derived from Ross 308 Broiler Performance Objectives (2022). Mixed-sex birds under standard management.
| Week | Age | Water/Bird/Day at 70°F | Water/Bird/Day at 80°F | Water/Bird/Day at 90°F | House Water/Day at 70°F | House Water/Day at 70°F |
|---|---|---|---|---|---|---|
| 1 | 7 days | 30 mL | 38 mL | 45 mL | 900 L | 238 gal |
| 2 | 14 days | 82 mL | 102 mL | 123 mL | 2,460 L | 650 gal |
| 3 | 21 days | 143 mL | 179 mL | 215 mL | 4,290 L | 1,133 gal |
| 4 | 28 days | 205 mL | 256 mL | 307 mL | 6,150 L | 1,625 gal |
| 5 | 35 days | 291 mL | 364 mL | 437 mL | 8,730 L | 2,306 gal |
| 6 | 42 days | 347 mL | 434 mL | 521 mL | 10,410 L | 2,749 gal |
| 7 | 49 days | 250 mL | 312 mL | 374 mL | 7,500 L | 1,981 gal |
- Cobb-Vantress. Cobb500 Broiler Management Guide — water-to-feed ratio of ~1.6:1 at 21°C. cobb-vantress.com
- Aviagen. Ross 308 Broiler Performance Objectives (2022) and Ross 308 Management Handbook. aviagen.com
- Feed intake derived from breeder 2022 performance objectives; see the feed consumption chart for the derivation tables.
Temperature Adjustment: The Number That Moves the Most
Water intake is stable at a comfortable house temperature and moves fast once birds start panting. Two rules cover most situations:
- Cool house (≤70°F): Track the base column — this is your cleanest baseline for comparing houses and flocks.
- Warm house (75–85°F): Expect roughly 2–3% more water per °F above 70°F. A 28-day bird at 80°F should drink about a quarter more than the same bird at 70°F — that increase is normal and healthy, not a leak.
- Heat stress (90°F+): Intake can approach double the cool-house figure as birds drink to cool themselves. Verify the increase is real (meter reading, not a stuck float) before treating it as a problem — but confirm cooling is working, because water alone cannot hold a house together in a heat event.
- Feed salt content: A feed mill change to a higher-salt ration raises drinking for days. Log feed changes with dates so a salt-driven water spike does not trigger a false alarm — and a genuine drop after a feed change gets investigated as a feed-quality problem.
When Water Reads Low: Decision Tree
Read meters at the same time daily. Confirm the birds-alive count is current — an overcount after culls makes every per-bird number wrong. Check for stuck floats, leaking lines, or a recent flush that inflated yesterday's number. A real 10%+ drop from your own baseline is the trigger for every step below.
Nipple pressure and height by bird age, line level, biofilm or clogged nipples, water medication making the water taste bitter, and any recent line work. Young birds especially — a pressure or height mistake stops small birds drinking before any adult bird shows a sign.
Water and feed track each other. Both down together → suspect environment, health, or house temperature. Water down but feed normal → suspect the water system specifically. Feed down but water normal → suspect feed quality, phase, or delivery — and re-read the feed chart decision tree.
House temperature, tunnel ventilation, cooling pad operation, and litter moisture. A hot house shows up in water intake first — often a day before birds pant visibly. A cold house in winter suppresses intake too, so never assume "low water" means heat.
Respiratory signs, wet litter, diarrhea, or unusual behavior point to disease — call your veterinarian with the water history attached. If the system and environment check out, log the deviation with its date, house, and temperature context, and re-check within 24 hours. Water problems compound fast; feed and weight problems follow within days.
How to Measure Water Consumption Per Bird
- Read at the same time daily: One fixed time each morning — the number is only comparable to yesterday's if the period is the same.
- Calculate per-bird intake: (Meter reading difference × 1,000) ÷ birds alive = milliliters per bird per day. Keep birds-alive counts current from mortality and cull logs.
- Log the context with the number: House temperature, feed changes, medication additions, and line work. A bare number cannot explain itself at 2 a.m. three days later.
- Flag deviation at 10%: A sustained drop of 10% or more from your own baseline is the action threshold — not the absolute chart figure, because every house has its own normal.
- Use it as the early-warning pair: Water is the first metric to move, feed the second, weight the third. Reading all three together is what turns a number into a decision.
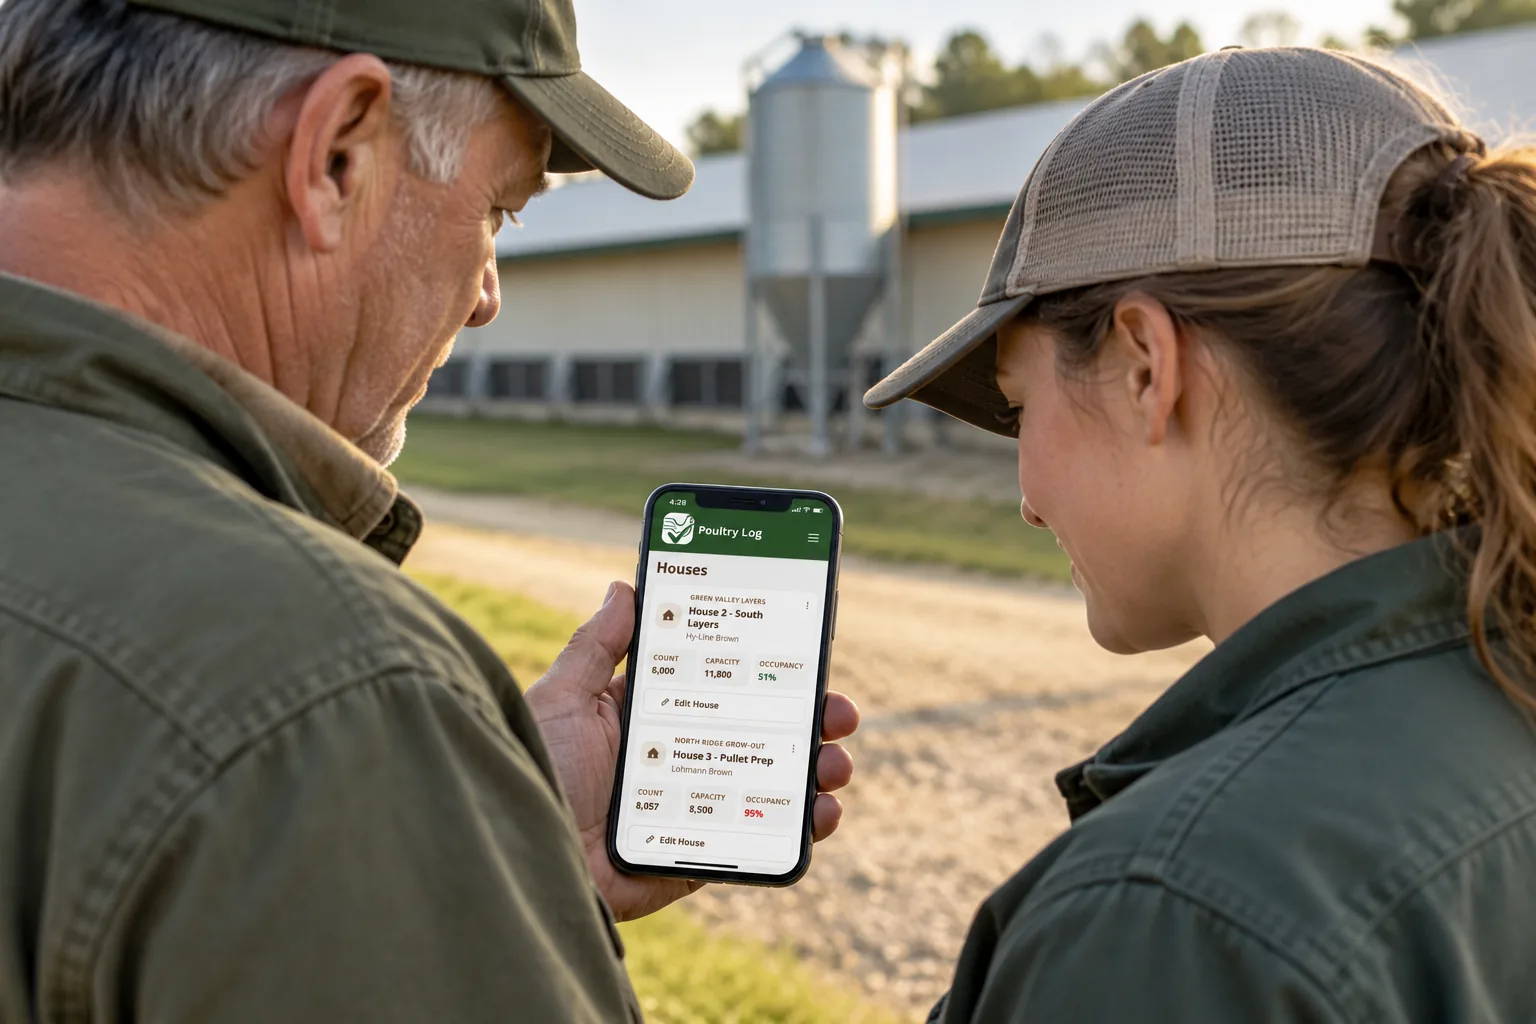
Tracking Water in Poultry Log
Water logs recorded in Poultry Log are stored with the time of entry, house, and reading — so a drop shows up as a dated change against the flock's own baseline, not a number you have to reconstruct from memory. Feed, mortality, and weight logs sit on the same timeline, which is what makes the water–feed–weight sequence readable instead of three separate spreadsheets.
The profitability dashboard ties the operational record to money: the water drop that becomes a health event that becomes a mortality spike that becomes cost per pound produced. Catching it at the water stage is the cheapest place in the chain — and the settlement calculator shows what a flock that finished on target is worth against one that did not.
- 2026-10-05: Initial version. Breeder-ratio-derived water tables for Cobb 500 and Ross 308, temperature adjustment rules, decision tree, and measurement protocol.