
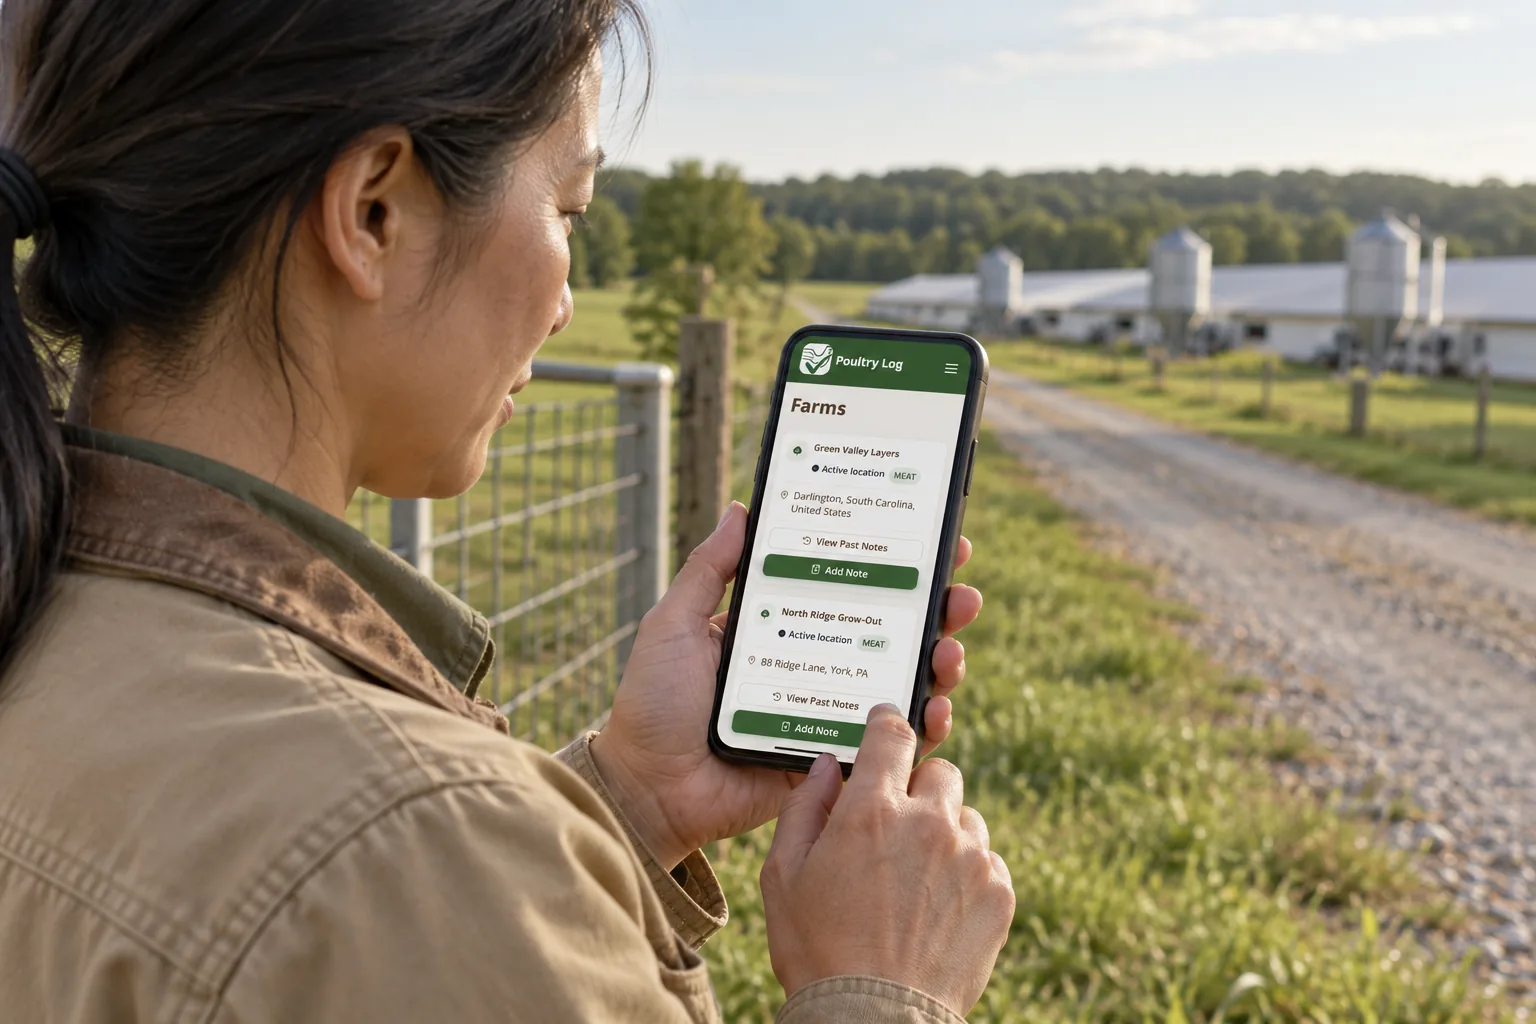
Water is the earliest warning system in a broiler house — birds drink before they eat, and they drink in patterns. A water-tracking app earns its place when it turns meter readings into a curve you can compare against the bird's age, the day's temperature, and the house next door. This page covers what water tracking demands for poultry specifically, what to verify in any app before you trust its early warnings, and where PoultryLog™'s record set stands against those demands.
What Does Water Tracking Demand?
| Demand | Why It Matters | What to Verify in Any App |
|---|---|---|
| Readings by house with time of day | A noon spike during heat means something different from an all-day sag — date-only totals lose the signal | Enter a reading with time; check how it appears in history and charts |
| Automatic per-bird conversion | Raw meter numbers mean nothing without flock size — mL per bird per day is the comparable unit | Confirm the app divides by birds alive, not birds placed |
| Age- and temperature-aware context | Expected intake rises ~2-3% per °F above 70°F; a reading that ignores the weather flags false alarms or misses real ones | Ask how the app handles temperature context — or whether you must interpret it yourself |
| House-to-house comparison | Two houses under the same weather drinking differently is the fastest way to find a line problem | Request a two-house water comparison in the demo |
| Deviation alerts against your own baseline | The signal is the change from normal — a sustained 10%+ drop from your baseline triggers a house check | Ask whether alerts compare to your flock's own history or only static targets |
What to Verify Before You Trust the Early Warning
- Time the entry in the house: meter reading, one-handed, under 30 seconds. Water is read daily — friction kills the habit that makes the signal exist.
- Check the per-bird math: enter a reading and a bird count; confirm the app converts to mL/bird/day automatically. Manual conversion is where errors hide.
- Run the comparison test: two houses, one chart. If the app cannot overlay them, you are back to two spreadsheets and an argument about which one is right.
- Confirm timestamps survive export: water records feed the settlement comparison and the cause review — they must export with house and time attached.
Where PoultryLog™ Fits
PoultryLog™ logs water readings by house with time-of-day stamps and automatic per-bird conversion — so a noon spike shows as a dated deviation against the flock's own curve, with temperature context and house comparison on the same timeline as feed, mortality, and weight. That structure is what turns the water signal into the early warning the water early-warning guide describes: the drop that precedes a drinker failure, the spike that precedes heat stress. It is strongest for contract broiler growers; for honest limits and other segments, see the buyer's guide.
Where the Money Shows Up
Water tracking pays at three moments. Mid-flock: a drop caught in hours is a line check today instead of a mortality event next week — on 30,000 birds, a disease event caught a week early can be the difference between treating a flock and losing a house's worth of birds. Heat season: the water spike tells you cooling is failing before birds pant, protecting the ADG that week-5 birds are worth the most per pound. And settlement: dated water records are part of the evidence chain that reconciles the integrator's sheet against your own — see the settlement calculator.
- Poultry management software buyer's guide — parent evaluation framework.
- Water consumption chart — expected intake by age and temperature.
- Water as early warning — the signal-reading method.
- 2026-10-05: Comprehensive rewrite. Demand table, verification drill, and honest positioning under the buyer's guide — replacing the earlier self-ranking version with an unverified competitor anecdote.
- Earlier version: "best app" ranking with unverified competitor claims.