
The broiler growth chart tells you what a bird should weigh each week. Daily weight gain — ADG — tells you how hard the flock is working right now. Average daily gain is the metric integrator performance sheets are built on, the first number that moves when something in the house is wrong, and the one that decides what your birds will weigh at catch. These week-by-week ADG targets for Cobb 500 and Ross 308 come from the same 2022 breeder objectives as the weight chart, so you can track both from one source.
Cobb 500 Daily Weight Gain Chart
Source: derived from Cobb-Vantress, Cobb500 Broiler Performance and Nutrition Supplement (2022), mixed-sex birds under standard management. Same source as the broiler growth chart weight tables.
| Week | Age | Weekly Gain | Avg Daily Gain | Avg Daily Gain | Phase |
|---|---|---|---|---|---|
| 1 | 7 days | 148 g | 21 g/day | 0.05 lb/day | Brooding |
| 2 | 14 days | 280 g | 40 g/day | 0.09 lb/day | Brooding |
| 3 | 21 days | 505 g | 72 g/day | 0.16 lb/day | Grower |
| 4 | 28 days | 645 g | 92 g/day | 0.20 lb/day | Grower |
| 5 | 35 days | 570 g | 81 g/day | 0.18 lb/day | Grower |
| 6 | 42 days | 720 g | 103 g/day | 0.23 lb/day | Finisher |
| 7 | 49 days | 390 g | 56 g/day | 0.12 lb/day | Finisher |
Ross 308 Daily Weight Gain Chart
Source: derived from Aviagen, Ross 308 Broiler Performance Objectives (2022), mixed-sex birds under standard management.
| Week | Age | Weekly Gain | Avg Daily Gain | Avg Daily Gain | Phase |
|---|---|---|---|---|---|
| 1 | 7 days | 148 g | 21 g/day | 0.05 lb/day | Brooding |
| 2 | 14 days | 295 g | 42 g/day | 0.09 lb/day | Brooding |
| 3 | 21 days | 455 g | 65 g/day | 0.14 lb/day | Grower |
| 4 | 28 days | 600 g | 86 g/day | 0.19 lb/day | Grower |
| 5 | 35 days | 690 g | 99 g/day | 0.22 lb/day | Grower |
| 6 | 42 days | 720 g | 103 g/day | 0.23 lb/day | Finisher |
| 7 | 49 days | 400 g | 57 g/day | 0.13 lb/day | Finisher |
- Cobb-Vantress. Cobb500 Broiler Performance and Nutrition Supplement (2022). Download PDF
- Aviagen. Ross 308 Broiler Performance Objectives (2022). aviagen.com
Reading the ADG Curve
Three phases show up clearly in both tables, and each phase has a different failure mode:
- Brooding (weeks 1–2): ADG roughly doubles each week — from about 21 g/day to 40–42 g/day. If week-2 ADG is not double week-1, the brood did not hold. Cold spots, early drinker access, and chick quality all show up here first.
- Grower (weeks 3–5): the gain engine. ADG climbs into the 70–100 g/day range — this is when the bird builds most of its saleable weight and when feed conversion decides your margin. A grower-phase ADG that plateaus early is expensive: the bird keeps eating (see the feed consumption chart) without gaining at the rate that pays for it.
- Finisher (weeks 6–7): ADG peaks, then falls. Around 103 g/day at week 6 for both breeds, then a sharp drop as birds approach market weight and FCR climbs. That drop is normal — but if it starts a week early, you are feeding expensive pounds that will never be paid for.
The two breeds reach the same peak ADG (~103 g/day at week 6) by different routes — Ross 308 front-loads more gain into week 5, Cobb 500 holds a steadier mid-cycle climb. If you do not know which strain you are growing, check your placement records; the difference in weekly expectations is small in week 1 but visible in the weekly weigh-in by week 4.
When ADG Falls Below Target: Decision Tree
Weigh 30–50 birds per house, randomly selected, mid-morning with empty crops, on a calibrated scale — the same protocol as the growth chart sampling guide. A single light sample is a measurement problem, not a flock problem. Compare the week-over-week change against the ADG target above, not just the absolute weight.
Pull this week's daily feed consumption per bird from your logs and compare it with the feed consumption chart. Feed light + ADG light = access, phase, or quality problem. Feed normal + ADG light = the birds are eating but not converting — environment or subclinical health is the usual cause.
Water intake moves hours before ADG does. Compare water per bird against the water consumption chart for the age and house temperature. Heat stress is the most common cause of a mid-cycle ADG slump after week 3 — a house running warm eats less, drinks more per pound gained, and gains slower in that order.
Morbidity the flock survives still steals ADG. Check mortality trends by house (see common mortality causes), litter condition, ammonia, and any treatments given. If uniformity is also slipping, the ADG problem may be access-driven — see the uniformity guide.
A 10% ADG shortfall in week 4 — 92 g/day target, 83 g actual — loses about 9 g/day × 7 days × 30,000 birds = roughly 4,200 lb of live weight at catch. Multiply by your contract's price per pound to see what the slump is worth, then decide: correct the cause and hold the schedule, or re-forecast the catch date and settlement with the settlement calculator.
The ADG Habit That Pays
Growers who track ADG weekly catch problems in the week they start, not the week before settlement. The habit is simple: weigh the same way every week, calculate the week's gain per bird, divide by seven, and write the number next to the target from these tables. One column, updated weekly, is the difference between managing growth and discovering it.
Tracking ADG in Poultry Log
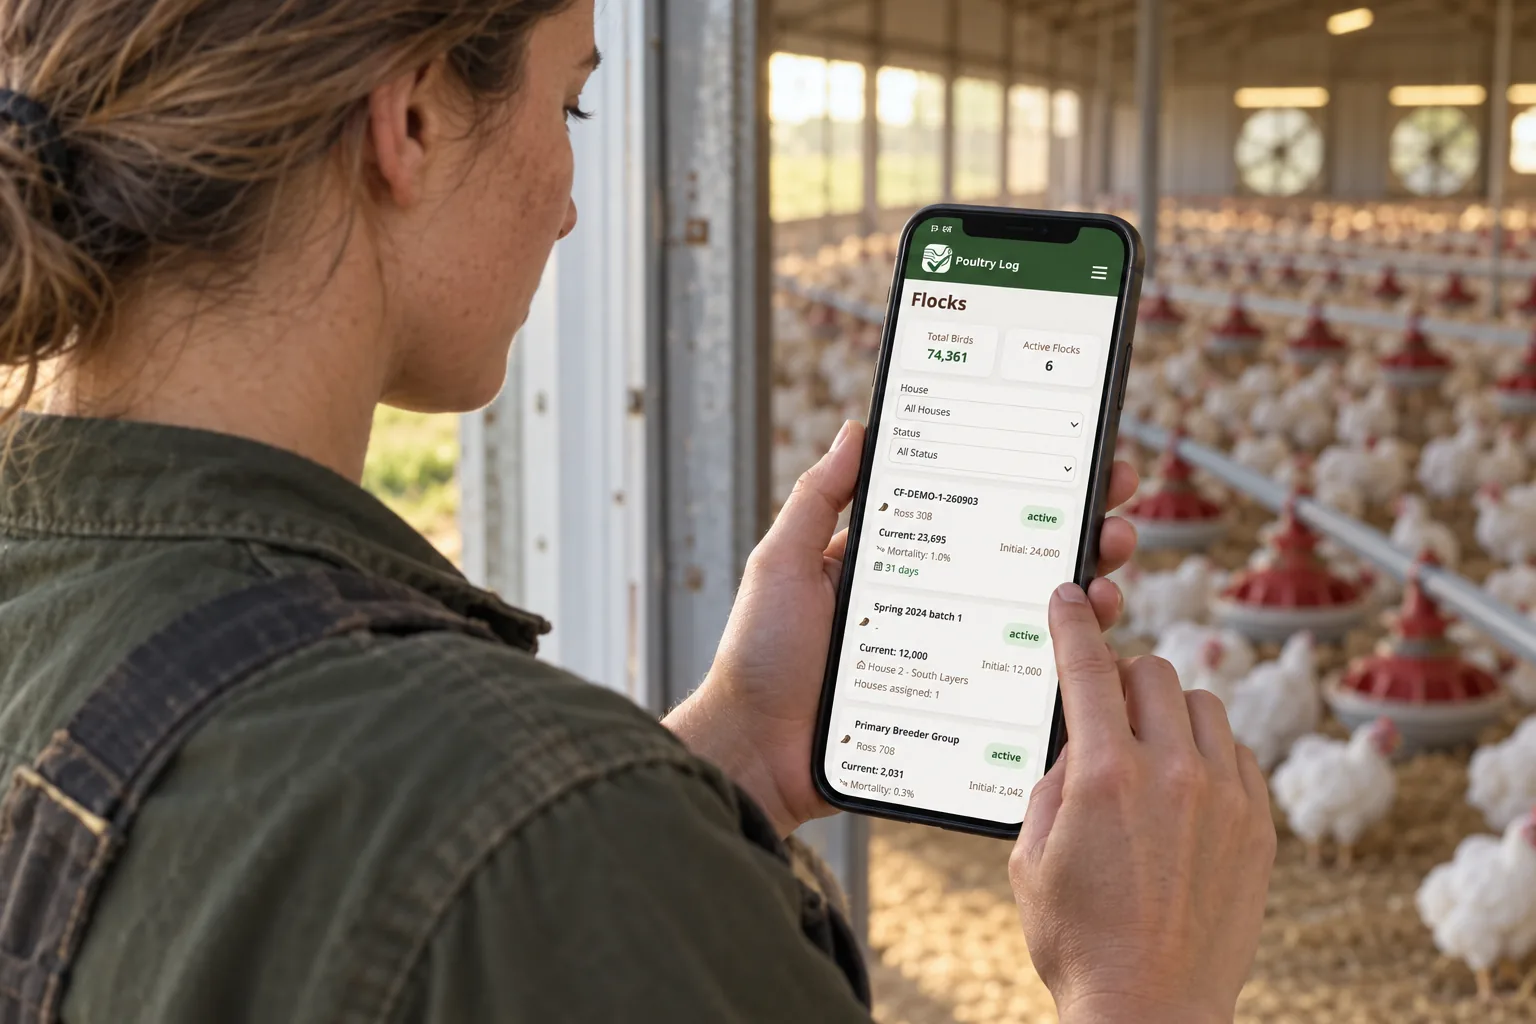
When sample weights are logged per house in Poultry Log, the system compares each week's actual gain against the target curve for your breed and age — so a 10% ADG shortfall surfaces as an alert with the house and date attached, instead of showing up on the settlement sheet. Feed, water, and mortality logs sit on the same timeline, which is what turns an ADG alert into a diagnosis: check what else moved in the same week before deciding what to change.
Every flock's ADG history feeds the profitability dashboard, where growth rate and feed conversion together explain what the flock earned — and the budget template uses your own weekly gain pattern to forecast the next placement instead of guessing from memory.
- 2026-10-05: Initial version. ADG tables derived from 2022 breeder objectives, phase interpretation, decision tree, and shortfall-to-dollars math.