
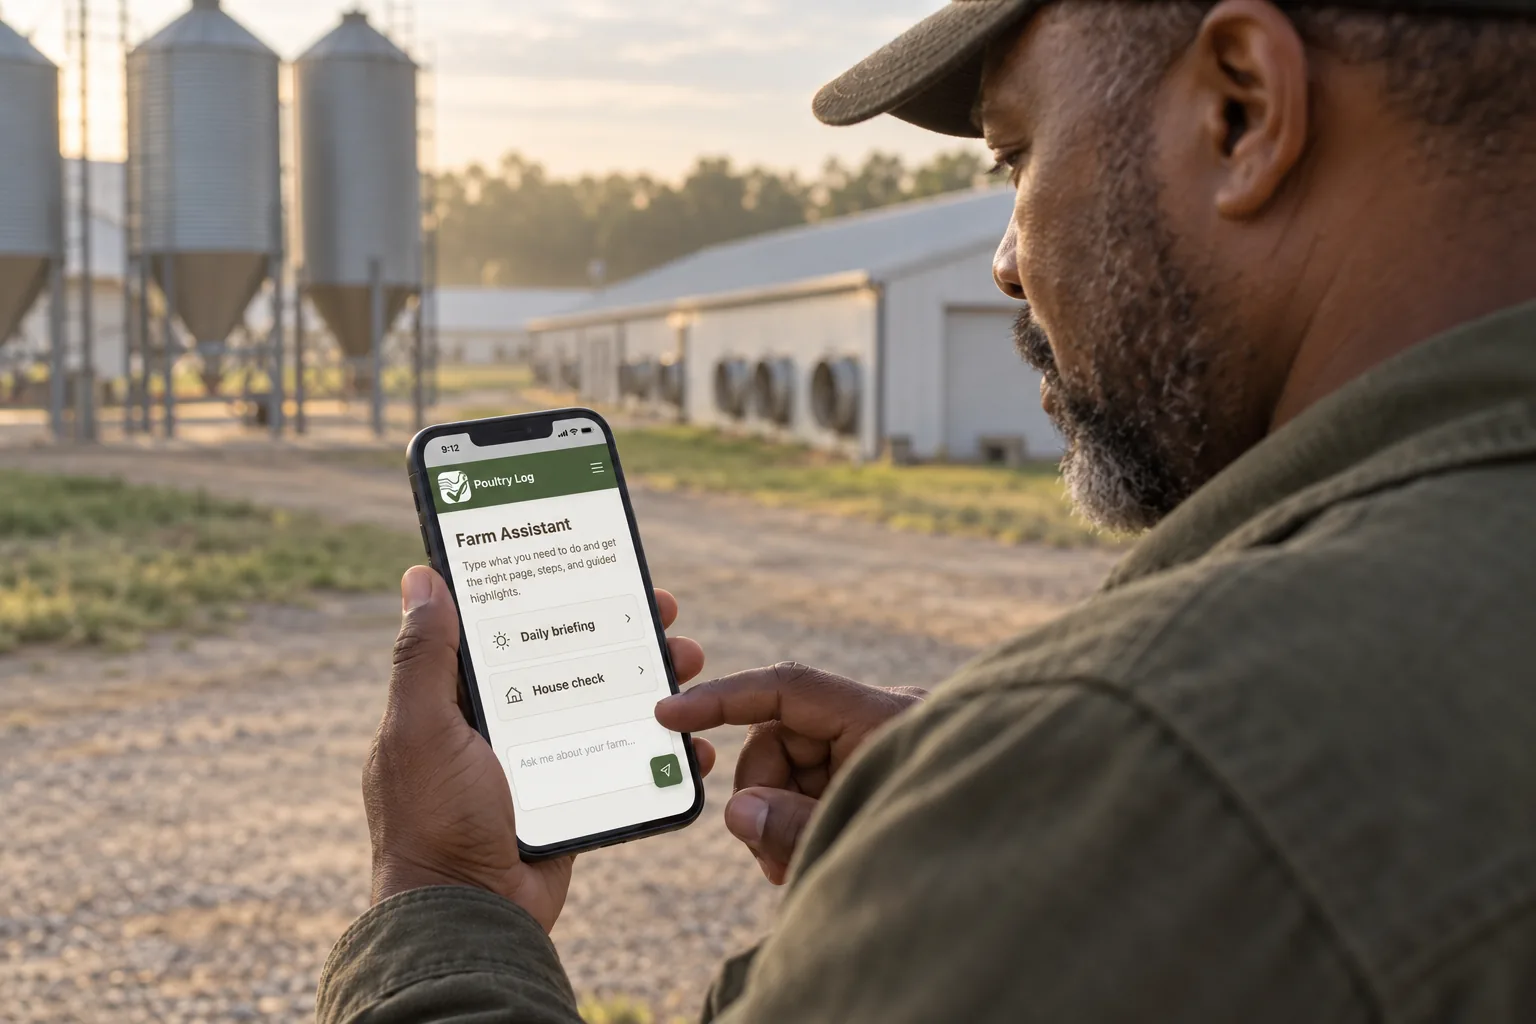
Feed is 60–70% of broiler production cost, so daily feed intake per bird is the number that decides your margin. These week-by-week intake targets for Cobb 500 and Ross 308 show what each bird should eat, what a full house should consume, and what to check when intake drops — because a flock eating 5% light in week 4 is a settlement problem you can still fix in week 5.
Cobb 500 Daily Feed Intake Chart
Source: derived from Cobb-Vantress, Cobb500 Broiler Performance and Nutrition Supplement (2022), mixed-sex birds under standard management. House figures use a 30,000-bird placement at $0.50/lb delivered feed.
| Week | Age | Avg Daily Feed/Bird | Avg Daily Feed/Bird | House Feed/Day | House Feed/Day | Cumulative Feed/Bird |
|---|---|---|---|---|---|---|
| 1 | 7 days | 19 g | 0.7 oz | 1,230 lb | $615 | 0.29 lb |
| 2 | 14 days | 49 g | 1.7 oz | 3,221 lb | $1,611 | 1.04 lb |
| 3 | 21 days | 98 g | 3.5 oz | 6,482 lb | $3,241 | 2.55 lb |
| 4 | 28 days | 137 g | 4.8 oz | 9,048 lb | $4,524 | 4.66 lb |
| 5 | 35 days | 167 g | 5.9 oz | 11,072 lb | $5,536 | 7.24 lb |
| 6 | 42 days | 223 g | 7.9 oz | 14,742 lb | $7,371 | 10.69 lb |
| 7 | 49 days | 145 g | 5.1 oz | 9,617 lb | $4,809 | 12.93 lb |
Week 7 runs light because the breeder table shows sharply reduced weight gain from day 42 to 49 — most contracts catch birds at 42–45 days, so week 6 is the number that matters for market-age flocks.
Ross 308 Daily Feed Intake Chart
Source: derived from Aviagen, Ross 308 Broiler Performance Objectives (2022), mixed-sex birds under standard management. Same house assumptions as above.
| Week | Age | Avg Daily Feed/Bird | Avg Daily Feed/Bird | House Feed/Day | House Feed/Day | Cumulative Feed/Bird |
|---|---|---|---|---|---|---|
| 1 | 7 days | 19 g | 0.7 oz | 1,230 lb | $615 | 0.29 lb |
| 2 | 14 days | 51 g | 1.8 oz | 3,373 lb | $1,687 | 1.07 lb |
| 3 | 21 days | 90 g | 3.2 oz | 5,919 lb | $2,960 | 2.44 lb |
| 4 | 28 days | 128 g | 4.5 oz | 8,446 lb | $4,223 | 4.43 lb |
| 5 | 35 days | 182 g | 6.4 oz | 12,044 lb | $6,022 | 7.24 lb |
| 6 | 42 days | 217 g | 7.7 oz | 14,325 lb | $7,163 | 10.68 lb |
| 7 | 49 days | 156 g | 5.5 oz | 10,300 lb | $5,150 | 13.00 lb |
- Cobb-Vantress. Cobb500 Broiler Performance and Nutrition Supplement (2022). Download PDF
- Aviagen. Ross 308 Broiler Performance Objectives (2022). aviagen.com
- Poultria. Cobb 500 Broiler Management Guide. poultria.com
Feed Budget Math: What a House Actually Eats
The week-6 column is where feed cost becomes real money. A 30,000-bird Cobb 500 house at breeder-objective performance eats roughly 14,700 lb of feed per day — about $7,370 per day at $0.50/lb delivered. Two deviations from that number are worth watching:
- A 5% intake drop is about $370 per day per house. Run a week light in week 4–5 and that is roughly $2,600 of feed not eaten — birds that do not gain the weight they were supposed to, at the same chick and housing cost.
- A 0.01 FCR improvement is worth about $960 per flock. On 30,000 birds to a 6.4 lb live weight, 0.01 FCR saves roughly 1,900 lb of feed — nearly $1,000 that drops straight to margin.
Compare your actual daily consumption per bird against these targets every morning, and compare each delivery against what the ration schedule says should be in the bin. Feed delivery errors — wrong phase, short load, wrong bin — are one of the quietest ways intake drifts off target without any bird showing a symptom.
When Birds Eat Less Than Target: Decision Tree
Compute intake as (feed delivered − feed remaining) ÷ birds alive ÷ days since last count. Confirm bin scales are accurate, the birds-alive count is current (not placement count), and no feeding was missed between readings. A stale bird count makes every intake number wrong.
Pan height, feed flow, and fill level must suit bird age. Is feed fresh, dry, and free of mold or fines? Does the delivered phase match the ration schedule for this week? Check for caked feed in the bin and for feed left in lines overnight.
Heat is the most common cause of intake drops after week 3 — expect roughly a 5% intake reduction for every 10°F above the comfort zone before it becomes a health problem. Verify tunnel ventilation, cooling pad wetting, and static pressure. Cold houses in winter suppress intake too.
Birds will not eat without water. Cross-check water consumption against the water chart — if water is down with feed, suspect drinker lines or environment; if only feed is down, suspect feed quality or phase. Then look for respiratory signs, lameness, or litter issues that suppress appetite before mortality shows it.
If intake has been 5%+ light for more than three days, project the weight shortfall against your target curve using the growth chart and decide: fix the cause and hold the schedule, or adjust the grow-out date and re-forecast settlement. The earlier the deviation is caught, the more options remain.
How to Measure Actual Daily Feed Intake
- Weigh at the same time daily: Read bin or feed-line weights at the same hour each morning, before the day's feeding runs, so every reading covers the same period.
- Count birds alive — not placed: Update the birds-alive count at least weekly from mortality and cull logs. Intake per bird is only as accurate as this count.
- Calculate consumption per bird per day: (Feed removed from bin over the period) ÷ (bird-days). Log it against the expected figure from the charts above.
- Log feed deliveries separately: Record weight, phase, time, and bin for every delivery so a wrong-phase load is caught on delivery day, not three days later when birds stop eating.
- Flag deviations at 5%: Anything more than 5% below the expected curve for your age for three consecutive days should trigger the decision tree above — not wait until the weekly weigh-in.
Tracking Feed Intake in Poultry Log
When feed deliveries, feed consumption logs, mortality, and sample weights are recorded in Poultry Log, daily intake per bird is calculated automatically against the target curve for your breed and age. Deviations past the threshold surface as alerts with the house and date attached, so the question "which house is eating light?" takes seconds instead of a spreadsheet session.
Each flock's feed numbers feed into the profitability dashboard, where intake drift shows up as cost per pound produced — and the budget template uses your own consumption history to forecast feed purchases for the next placement instead of guessing from last season.
- 2026-10-05: Initial version. Derived daily intake tables from 2022 breeder objectives, added house feed budget math, decision tree, and measurement protocol.