

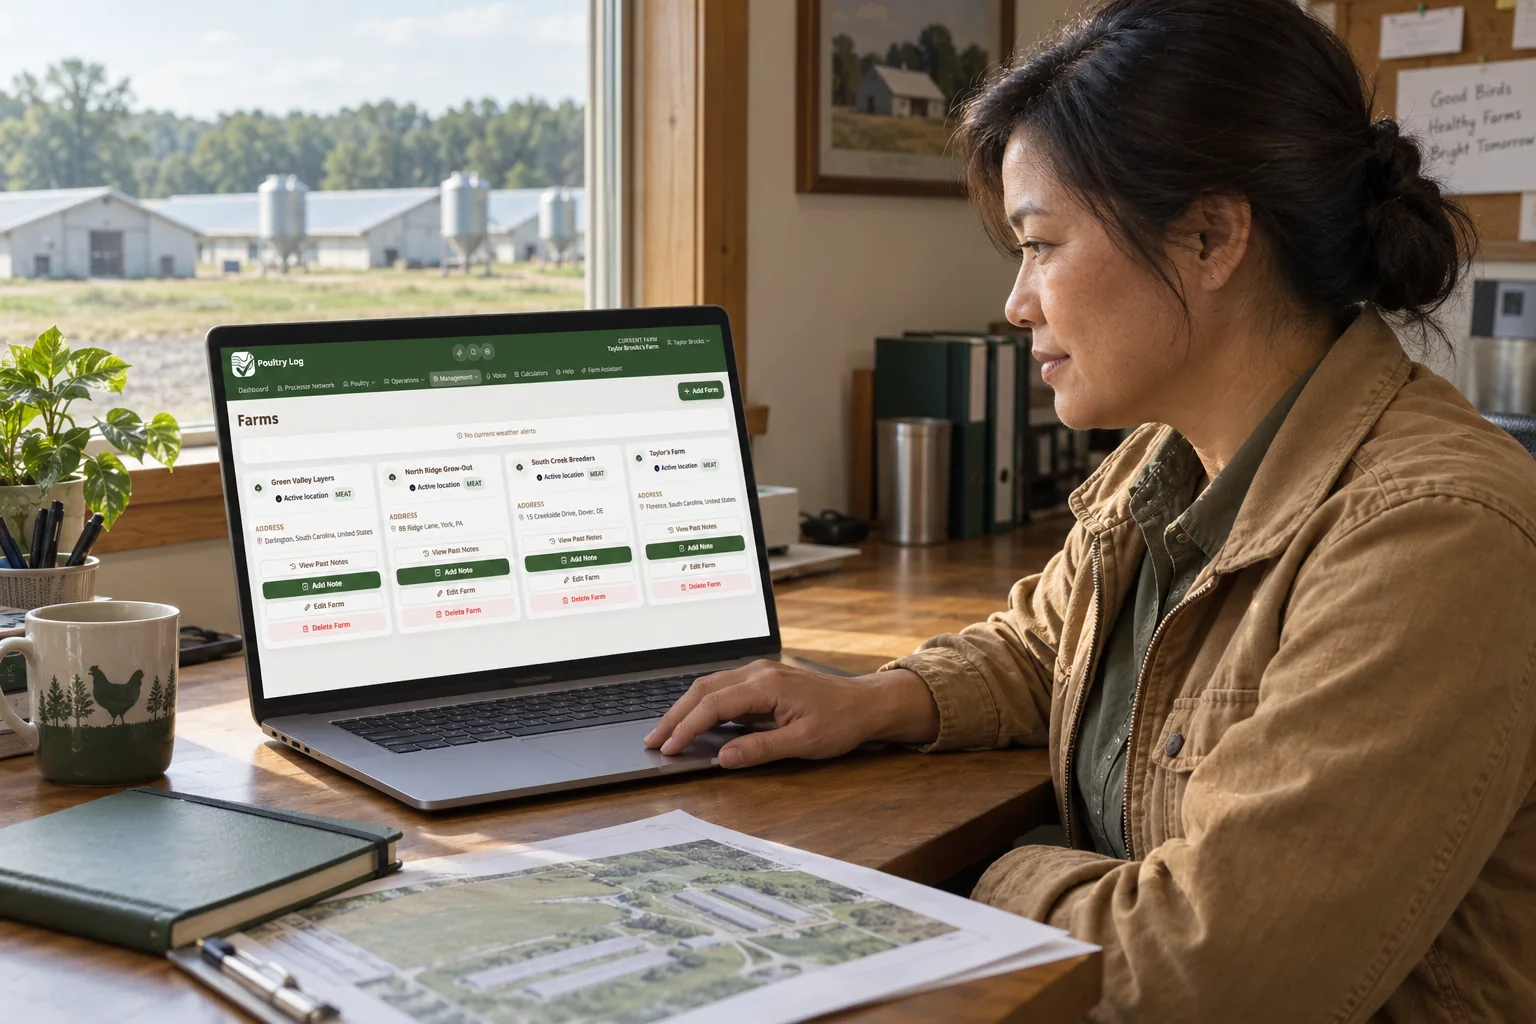
A poultry processor dashboard is where fleet oversight happens: farms, houses, flocks, compliance submissions, and biosecurity alerts, on one screen, updated from what growers actually log. For an integrator running hundreds or thousands of contract farms, that single view is the difference between managing the network and chasing it. The Poultry Log processor console is built as that dashboard, with five working views that each answer a different operational question.
Grower Fleet: The Network at a Glance
The fleet view opens with the numbers that frame everything else: grower farm count, house count, active flocks, total birds placed, current birds on feed, and compliance submissions across the network. It also shows the age pipeline of the current flock population, bucketed as brooding (0 to 7 days), early growth (8 to 14), main growth (15 to 28), finishing (29 to 42), and heavy (43 plus). When compliance submissions drop in the early growth bucket while bird counts hold steady, the operations team knows where to look before an audit asks.
House Benchmarking: Where the Differences Live
The benchmarking view reports each house by capacity, flock name and age, initial and current bird counts, mortality rate, cull rate, average daily water in liters, water per bird in milliliters, compliance record count, and last log date. Mortality is computed from recorded losses for the active flock rather than bird-count deltas, so the number reflects what was logged. Houses can be sorted by flock age, current count, or mortality rate, and selected for side-by-side comparison, with benchmark status drawn from the processor's own threshold policy.
Week-over-Week: Trend, Not Snapshot
Flock weeks one through ten come through the week-over-week view with flocks reporting, records submitted, target versus actual weight, average mortality, average water use with unit conversion from whatever the grower logged, equipment pass rate, and rodent incident rate. Multi-grower charts make it possible to tell one farm's bad week from a network-wide pattern, and the rate-versus-totals toggle keeps a big farm from looking like a problem just because it is big.
Compliance Logs and Admin Team
The compliance logs tab searches every submitted checklist across linked growers by farm, template, status, and date range, with print and PDF or Excel export for audit packages. The admin team tab holds the threshold policy itself: warning and critical limits for mortality, culls, and water use by day, week, and flock period, plus processor staff invitations with admin and viewer roles.
What the Dashboard Does Not Do
The console reports what was submitted and what breached the processor's own thresholds. It does not invent a compliance percentage or breed-specific target curves. Grower-supplied checklists support audit readiness; they do not certify legal compliance on their own. That boundary keeps the dashboard defensible in front of auditors and customers.
Where Poultry Log Fits
The dashboard reads from Poultry Log's grower-side records, so fleet oversight does not require a parallel reporting project from the farms. The house-level comparison detail is covered in the grower house benchmarking guide, with alerts explained in the processor biosecurity alerts guide and the export workflow in the audit trail exports guide. Start free at poultrylog.com.
Frequently Asked Questions
What should a poultry processor dashboard show?
Farm and house counts, active flocks, birds placed and currently on feed, compliance submissions, house-level mortality, culls and water use, week-over-week trends against target weight, and an alert stream for biosecurity and threshold breaches, all drawn from grower-submitted records.
How do integrators get real-time farm data without new hardware?
By reading the records growers already log. In the Poultry Log processor network, growers submit weekly and daily checklists in their own app, and the processor console aggregates those submissions into fleet, benchmarking, and trend views.
Who can configure thresholds in a poultry processor console?
Processor staff with the admin role, in the console's admin team view. Viewers can read the dashboard and logs without changing policy, and processor membership never unlocks unrelated grower pages.