

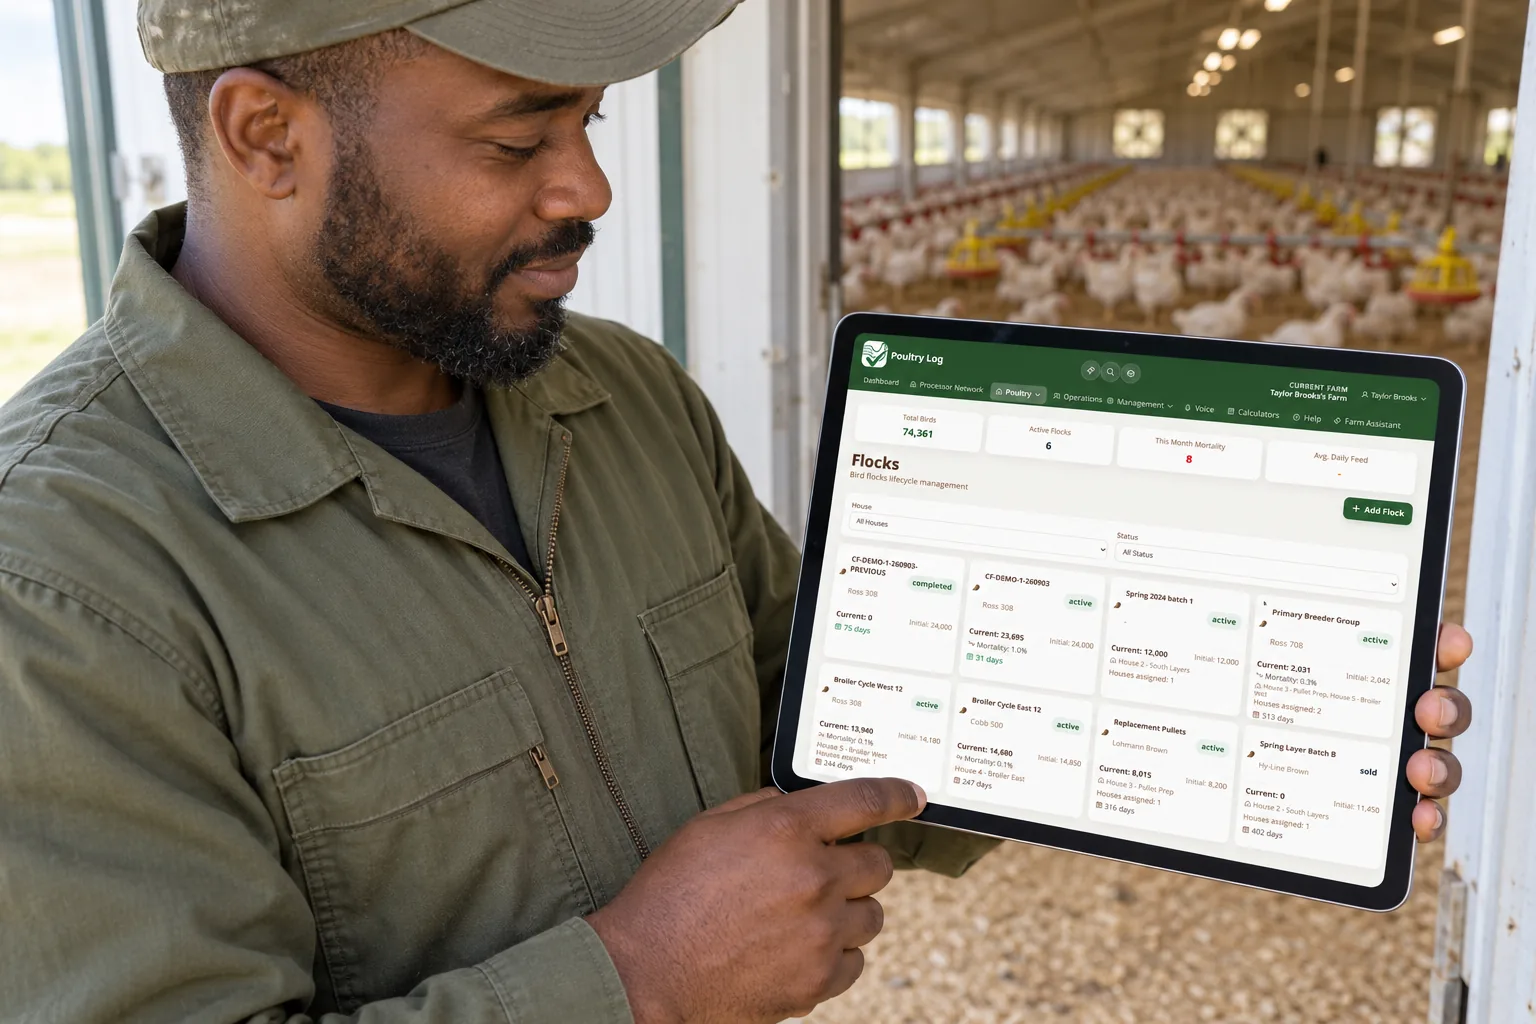
Mortality and cull rates are the two numbers that decide whether a broiler flock's performance story is honest. They are also the two numbers most likely to be argued about at settlement, because paper records and integrator sheets rarely agree on how a loss was counted. For a poultry integrator running a grower network, tracking mortality and culls house by house, from the same records the grower logs, changes that conversation from argument to comparison.
How the Processor Console Computes the Rates
House Benchmarking in the Poultry Log processor console reports mortality rate and cull rate for every house in the network, computed from the losses recorded for the active flock rather than from bird-count deltas between placements. That distinction matters: a bird-count difference can include transfers or recount corrections, while the recorded-loss approach reflects what the grower actually logged day by day. Initial and current bird counts sit next to the rates, so the denominator is always visible.
What the Threshold Policy Adds
Bare rates invite opinion; thresholds make them operational. In the console's admin view, the processor sets warning and critical limits for mortality and culls by day, by week, and by full flock period, plus rise and drop percentage checks that catch sudden movement inside an otherwise acceptable range. Breaches raise alerts with current versus previous rates attached, and each alert opens a details view showing the raw logs, inputs, and sources behind the calculation.
How Growers' Records Feed the Numbers
Mortality and cull entries come from the grower's daily record in Poultry Log: the daily crop checklist captures mortality rate per house per day, alongside target weight, actual weight, and water use. Because the entry is part of the daily routine rather than a monthly estimate, the network's mortality series has daily resolution, and a spike can be traced to the day it happened rather than reconstructed later. The same records power the grower's own dashboard, which is why both sides are reading the same entry when the settlement conversation starts.
What the Comparison Makes Visible
- A house running above the network's mortality average in weeks four through six, while its weight against target holds
- A cull rate that rises without a mortality rise, which usually points to a different problem entirely
- Regional patterns, such as a heat event lifting mortality across every grower in the same area in the same week
- Farms whose daily records stop arriving, which is itself a signal worth a phone call
Where Poultry Log Fits
Mortality and cull tracking is only as trustworthy as the daily record behind it, and that record lives in Poultry Log, where growers already log it. The house-level comparison is covered in the grower house benchmarking guide, the weekly trend in the processor week-over-week performance guide, and the alert flow in the processor biosecurity alerts guide. Start free at poultrylog.com.
Frequently Asked Questions
How do poultry integrators track mortality across grower farms?
By aggregating the daily mortality records growers log per house. The Poultry Log processor console computes mortality rate from recorded losses for the active flock, compares it against the processor's own warning and critical limits, and raises alerts with previous rates attached for context.
What is the difference between mortality rate and cull rate in broilers?
Mortality rate counts birds that died in the flock; cull rate counts birds removed alive for welfare or health reasons. In the processor console both are reported per house against threshold policy, because a rise in one without the other usually points to a different problem.
Can a poultry processor set mortality limits by flock week?
Yes. Threshold policy in the Poultry Log processor console is configured per metric and per period, including day, week, and full flock limits, with separate warning and critical levels and optional rise or drop percentage checks.