

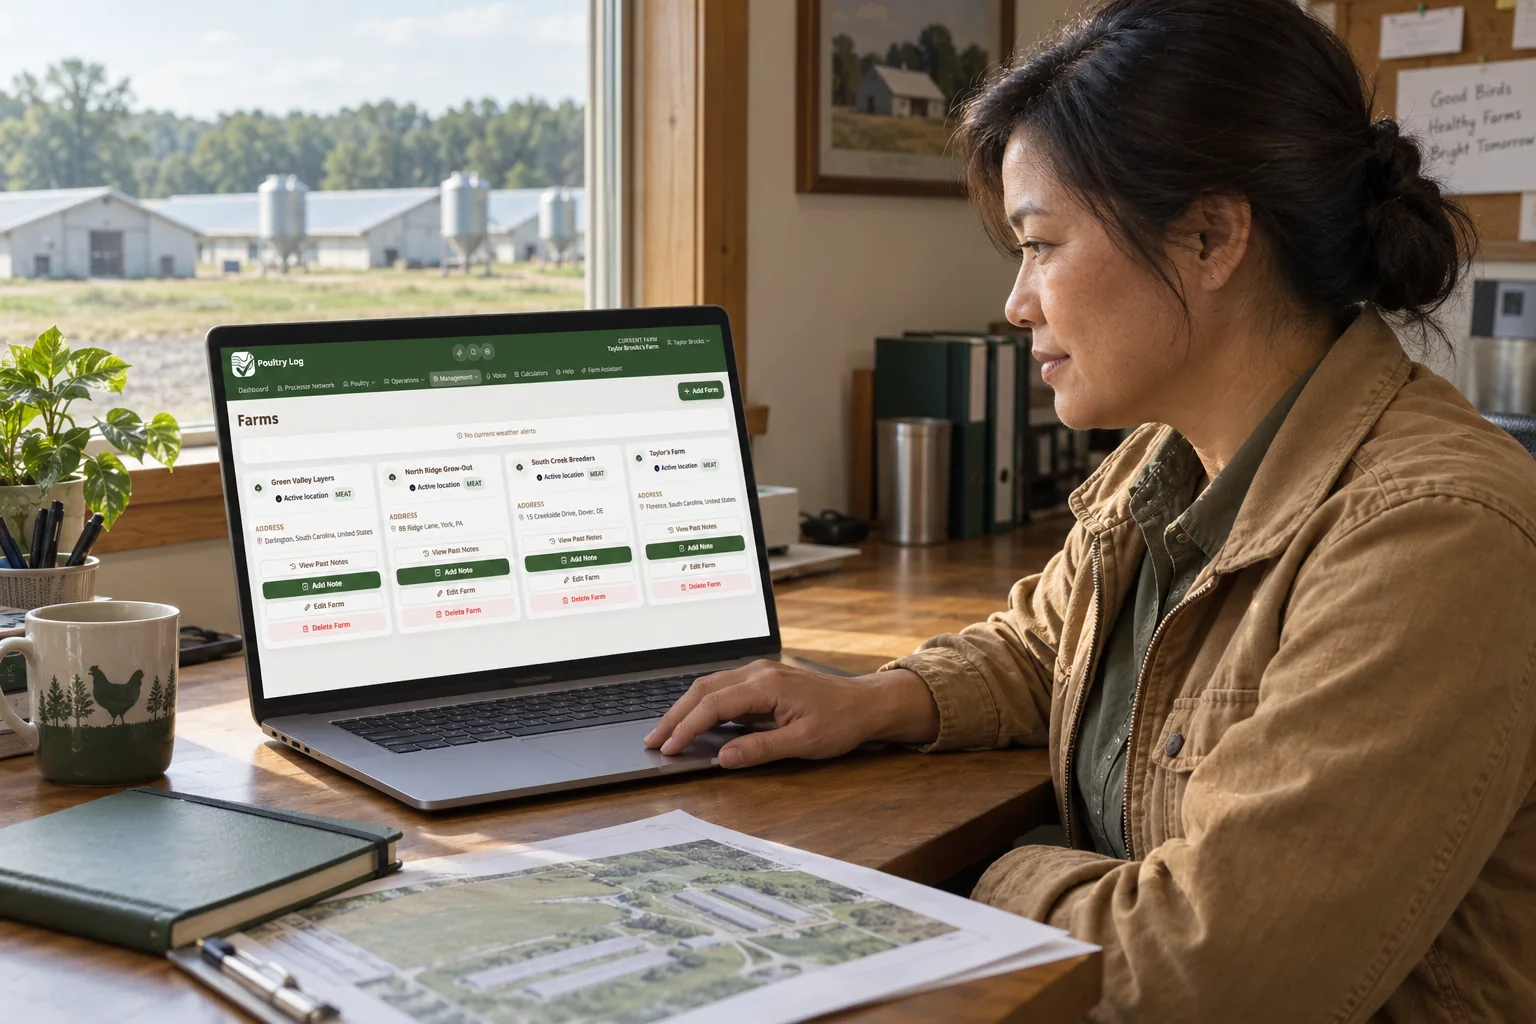
Poultry processors increasingly publish sustainability commitments: water stewardship, animal welfare indicators, responsible antibiotic use, environmental compliance. What those commitments mean at farm level is a data question, and the answer has to come from the growers. A processor who cannot see water per bird, mortality rates, or compliance submission consistency across the network cannot manage toward a sustainability target; they can only report one. The Poultry Log processor console reports exactly the farm-level evidence those programs are built on.
The Farm-Level Data Behind Processor Sustainability Claims
- Water stewardship - average daily water per house in liters and water per bird in milliliters, converted automatically from whatever unit each grower logged, so a network spanning countries still produces one comparable series.
- Animal welfare indicators - daily mortality rate, cull rate, and weight against target per house, reported as trends rather than annual snapshots.
- Biosecurity and equipment discipline - weekly equipment pass rates and rodent incident rates across the network, with corrective actions recorded on failures.
- Compliance submission consistency - submission counts by farm and week, so "are the records actually being kept" is a measurable operational fact rather than an assumption.
Why the Data Has to Come From Daily Records
Sustainability reporting fails when it is assembled annually from estimates. The metrics above are only trustworthy when they come from daily operational records: the water meter read per house, the mortality logged per day, the checklist completed per week. In Poultry Log, those records are the byproduct of farm work rather than a separate reporting exercise, which is what makes them consistent enough to aggregate into a network view and defensible enough to stand behind in a published commitment.
What the Console Does With the Data
The processor console aggregates submitted records into fleet, benchmarking, week-over-week, and compliance log views, with threshold policy set by the processor per metric and period. That gives a sustainability program the two things it actually needs: a baseline built from real records, and an operational signal when a metric drifts from the policy. The console reports what was submitted and what breached thresholds; it does not compute a compliance percentage or invent target curves.
What Poultry Log Does Not Claim
Poultry Log does not produce sustainability reports, ESG disclosures, or certifications, and the farm-level metrics it aggregates are operational records rather than audited sustainability claims. The publishing, verification, and defense of any sustainability commitment stay with the processor and its advisers. What the record layer provides is the farm-level evidence those commitments rest on, consistent and attributable.
Where Poultry Log Fits
Poultry Log is where the daily evidence originates, which is why network-level sustainability metrics start trustworthy. The water metrics are covered in the water use monitoring guide, welfare-adjacent records in the EU broiler welfare guide, and the console views in the processor dashboard guide. Start free at poultrylog.com.
Frequently Asked Questions
What farm data do poultry processors need for sustainability reporting?
Water use per bird, mortality and cull rates, weight against target, equipment pass rates, rodent incident rates, and compliance submission consistency, all drawn from daily operational records. The Poultry Log processor console aggregates exactly these metrics across every consented grower.
How do poultry growers contribute to integrator sustainability programs?
By keeping the daily records the program's metrics are built on: water meter readings per house, daily mortality and weight entries, and weekly compliance checklists. In Poultry Log, these are part of the normal farm workflow rather than a separate reporting task.
Does Poultry Log generate sustainability reports for processors?
No. Poultry Log aggregates the farm-level operational metrics those programs are built on; the publishing, verification, and defense of any sustainability commitment stay with the processor and its advisers.