
A weigh-in is only as good as its method. The same birds, the same time of day, the same scale, every week — change any of those and you are comparing measurements, not flocks. This page is the standalone protocol behind every weight number in the growth chart cluster: how many birds to weigh, when, on what, and what to calculate — average, standard deviation, and CV% — so the trend you track is the flock's, not the scale's.
The Protocol, Step by Step
- Sample 30–50 birds per house, or 1–2% of the flock if larger. More birds describe the distribution better — 50 is meaningfully more informative than 20, especially for CV%. Select randomly: do not pick the birds nearest the door, and do not exclude visibly light birds — they are the signal, not the noise.
- Weigh mid-morning, after crops have emptied but before afternoon feed fills them. Crop fill shifts individual weights by grams and the average by enough to fake a trend. Same hour every sampling day.
- Weigh individually, not as a group. A group weight gives you an average with no distribution — CV% is impossible from it. Use a hanging gram scale or a certified digital platform.
- Check the scale weekly. A known-weight check (a calibrated test weight, or a bird of known weight) before sampling catches drift. A scale reading 3% light makes every trend you track wrong in the same direction.
- Calculate three numbers: average weight (g), standard deviation (g), and CV% = (standard deviation ÷ average) × 100. A phone calculator handles it; the calculation is one division.
- Compare against the right reference: the breeder targets for your strain and age, the action bands for how far behind is actionable, and your own previous flocks — your history is the most honest benchmark you have.
- Log it all: date, house, number of birds, average, SD, CV%. A CV% without a record is an anecdote; a logged series is how you prove a pattern — or prove there is not one.
Reading the Numbers: A Worked Example
A 40-bird sample from house 2 at day 21: average weight 1,485 g, standard deviation 118 g. CV% = 118 ÷ 1,485 × 100 = 7.9%. Against the day-21 uniformity target (CV% ≤ 10%), house 2 is tight — no action needed beyond logging.
House 1 the same day: average 1,440 g, standard deviation 161 g. CV% = 11.2% — above the target, and the average is also 3.5% below the breeder curve. That combination — wide and light — points at access problems rather than disease, because disease thins a flock while access problems strand a subpopulation. The uniformity guide covers the diagnosis; this protocol is what made the numbers trustworthy enough to act on.
Common Protocol Errors
| Error | What It Does to the Data |
|---|---|
| Convenience sampling (birds near the door) | Biases the average; hides the subpopulation the protocol exists to find |
| Weighing after afternoon feed | Inflates averages variably; fakes week-to-week swings |
| Group weights instead of individual | Destroys CV% — the distribution metric that matters most |
| Uncalibrated scale | Shifts every reading in the same direction; fake trends in both directions |
| Different method between weeks | Turns the trend line into a comparison of methods, not flocks |
Tracking Weights in Poultry Log™
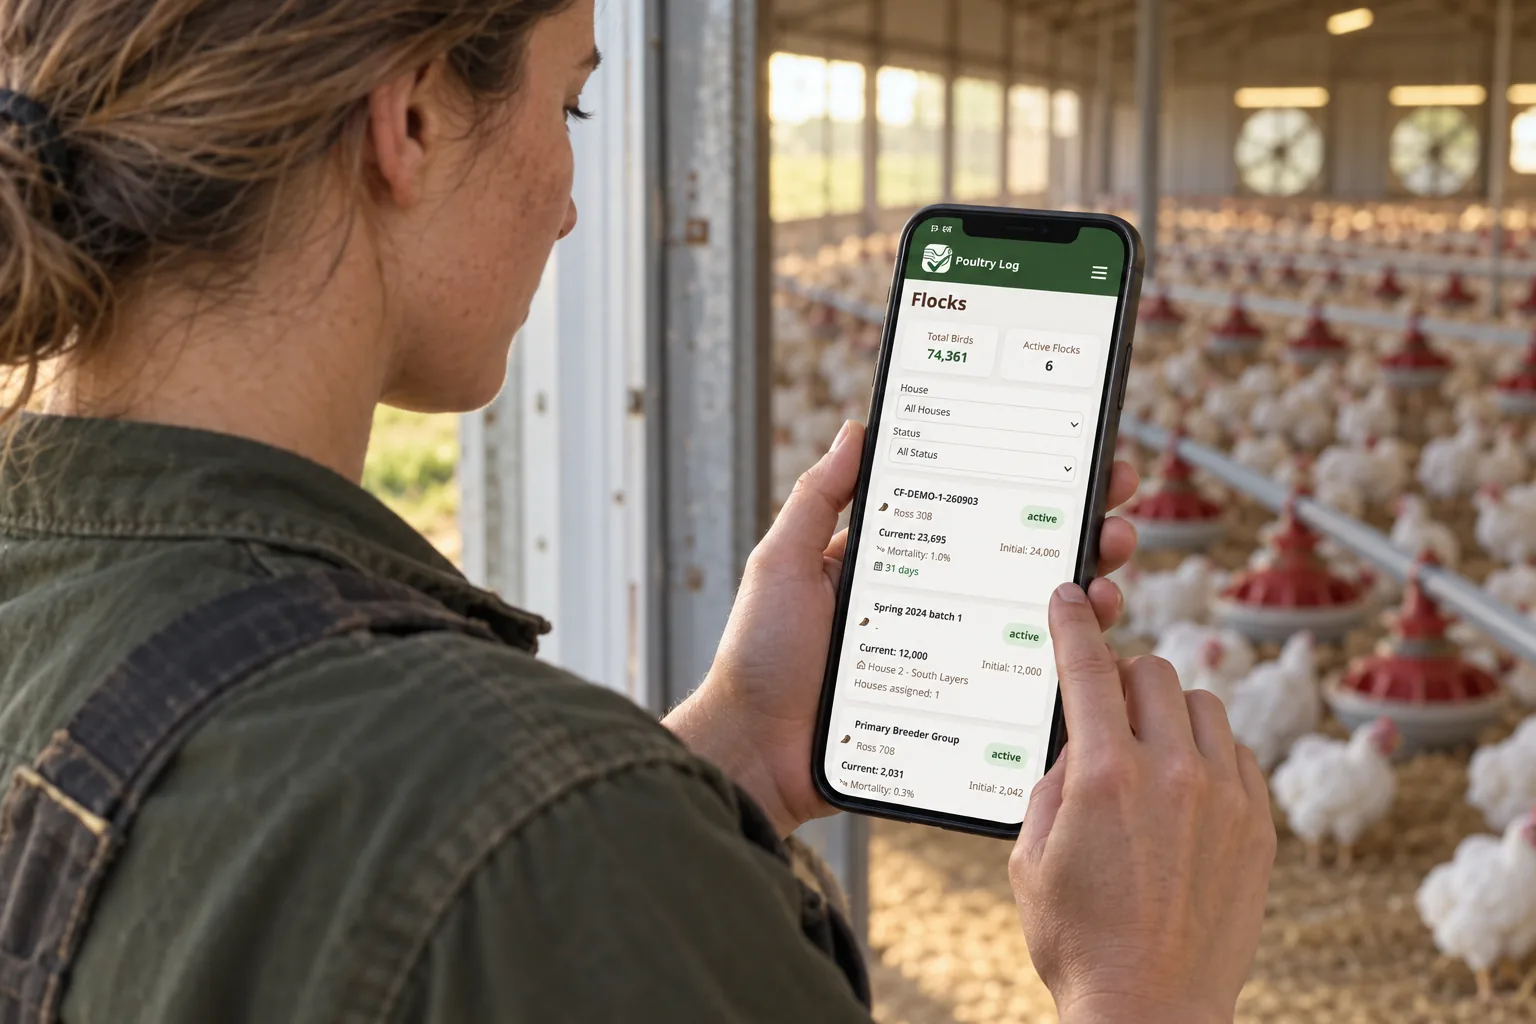
Individual sample weights logged per house in Poultry Log™ compute average, CV%, and the comparison to breed target automatically — so the protocol's outputs land in the record without a spreadsheet step. Weekly weigh-ins feed the ADG chart comparison, the action bands, and the uniformity series — and every flock's weight history feeds the profitability dashboard, where growth rate and feed conversion together explain what the flock earned.
- 2026-10-05: Comprehensive rewrite. Seven-step protocol, worked CV% example, error table, and tool linkage — replacing the earlier short note.
- Earlier version: brief note on same-method sampling.