
Poultry farm cash flow has a shape unlike most businesses: a large lump of cash leaves before the first bird pays anything back, and the revenue arrives in one settlement check weeks after the last feed delivery. Growers who plan around that shape — timing chick purchases, feed commitments, and fixed costs against the settlement calendar — stay solvent through the cycle. Growers who plan around monthly averages discover the gap when the feed bill arrives in week three and the payment lands in week nine. This page covers the cash-flow cycle, the worked timing example, and the records that make the next placement predictable.
The Poultry Cash-Flow Cycle
| Week | Cash Out | Cash In | What Decides the Margin |
|---|---|---|---|
| Pre-placement | Chicks (~$6,000 on 30,000 at $0.20), bedding, first feed order, possibly chick-buy deposit | None — or advance payments where the contract offers them | Whether the deposit terms and chick price were negotiated before the order, not after |
| Weeks 1–2 | Feed begins (~$1,610/week at 30,000 birds per the feed chart), energy | None | Brood held — a failed brood in week 1 costs the whole cycle's margin |
| Weeks 3–5 | Feed escalates fast (~$3,240 → $5,540/week), bedding, medication | None | Feed conversion — this is where FCR drift becomes a cash-flow event, not just a settlement one |
| Week 6 | Peak feed (~$7,370/week), catch crew, trucking | None | Catch timing — every extra week is peak feed cost against diminishing gain (see the catch chart) |
| Weeks 7–8 | Settlement processing, cleanout, downtime costs | Settlement payment — the single large inflow | Whether the settlement matches your records — the comparison method checks it |
The Worked Timing Example
Example only — labeled assumptions from the break-even worked example. On the 30,000-bird example flock: total feed spend across the cycle runs about $160,350, with roughly $7,370 in the peak week alone. Total flock cost lands near $178,050, and the settlement revenue arrives as one payment after catch. The cash-flow facts that follow from those numbers:
- The peak-week feed bill is the pressure point. $7,370 in week 6, on a farm that has spent four weeks without revenue. A $10,000 operating buffer covers roughly one peak week — most growers who hit cash-flow trouble hit it here, not at settlement.
- Feed price movement compounds across weeks. A $0.05/lb increase on the example flock adds about $8,000 across the cycle — felt weekly, paid in full only at settlement.
- The settlement lag is the planning horizon. From chick buy to payment is roughly 7–8 weeks. Every placement decision is really a decision about what cash you need available for two months, not two weeks.
Cash-Flow Planning Habits
- Map the cycle before the placement. Chick cost, projected feed curve (from the feed chart × your price), energy, and fixed costs against the expected settlement date. If the mapped outflows exceed available cash plus the projected settlement, the placement does not fit — regardless of how good the flock looks on paper.
- Maintain a peak-week buffer. Size it to at least one peak feed week plus a margin for price movement. The buffer is what turns a feed-price surprise from a crisis into a line item.
- Separate flock cash from farm cash. Settlement income pays for the next flock — commingling it with household or fixed-cost spending is how operations discover they cannot place again on time. Per-flock expense attribution (the cost per bird guide) makes the separation visible.
- Track actuals against the map weekly. Feed deliveries logged against the projected curve catch cost drift early — the same weekly discipline the feed cost guide describes.
Building the Cash-Flow View in Poultry Log™
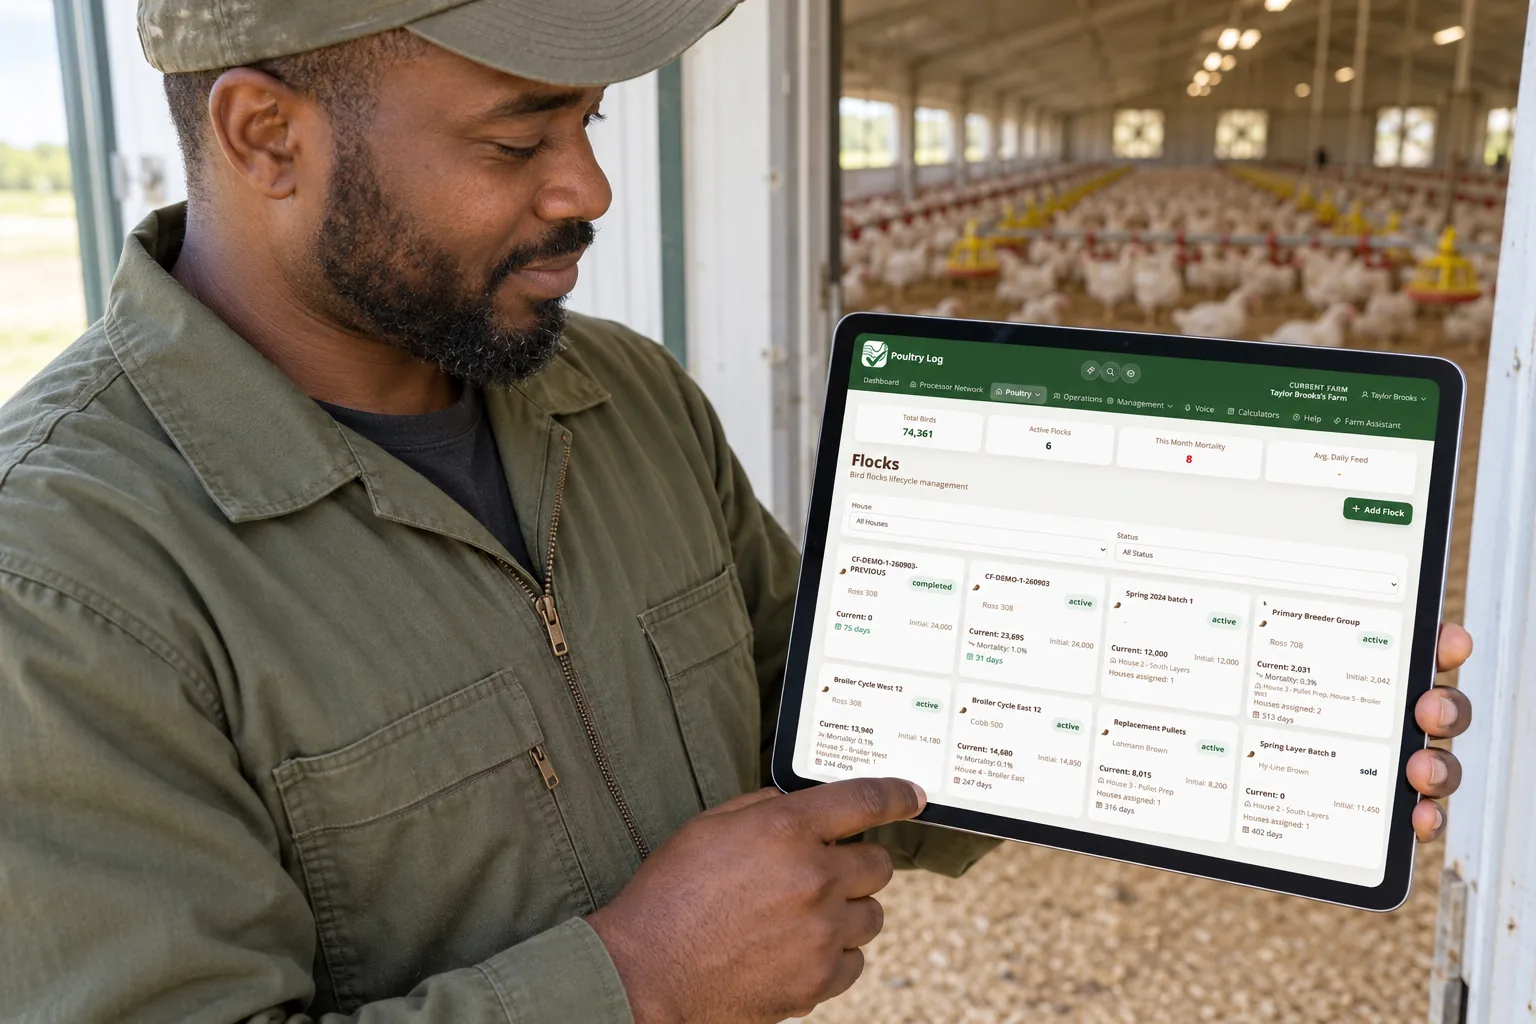
When feed deliveries, expenses, and settlement income are logged against the flock they belong to, the cash-flow view builds itself: spend to date, projected spend to catch, and the settlement recorded against the same flock. The budget template uses your own consumption history to forecast the next placement; the break-even price supplies the per-pound floor; and the profitability dashboard carries the multi-flock trend that shows whether the cash-flow shape is improving or drifting.
- 2026-10-06: Comprehensive rewrite. Cash-flow cycle table, worked timing example from the break-even figures, and planning-habit framework — replacing the earlier boilerplate version.
- Earlier version: short first-person note on logging cash flow.