
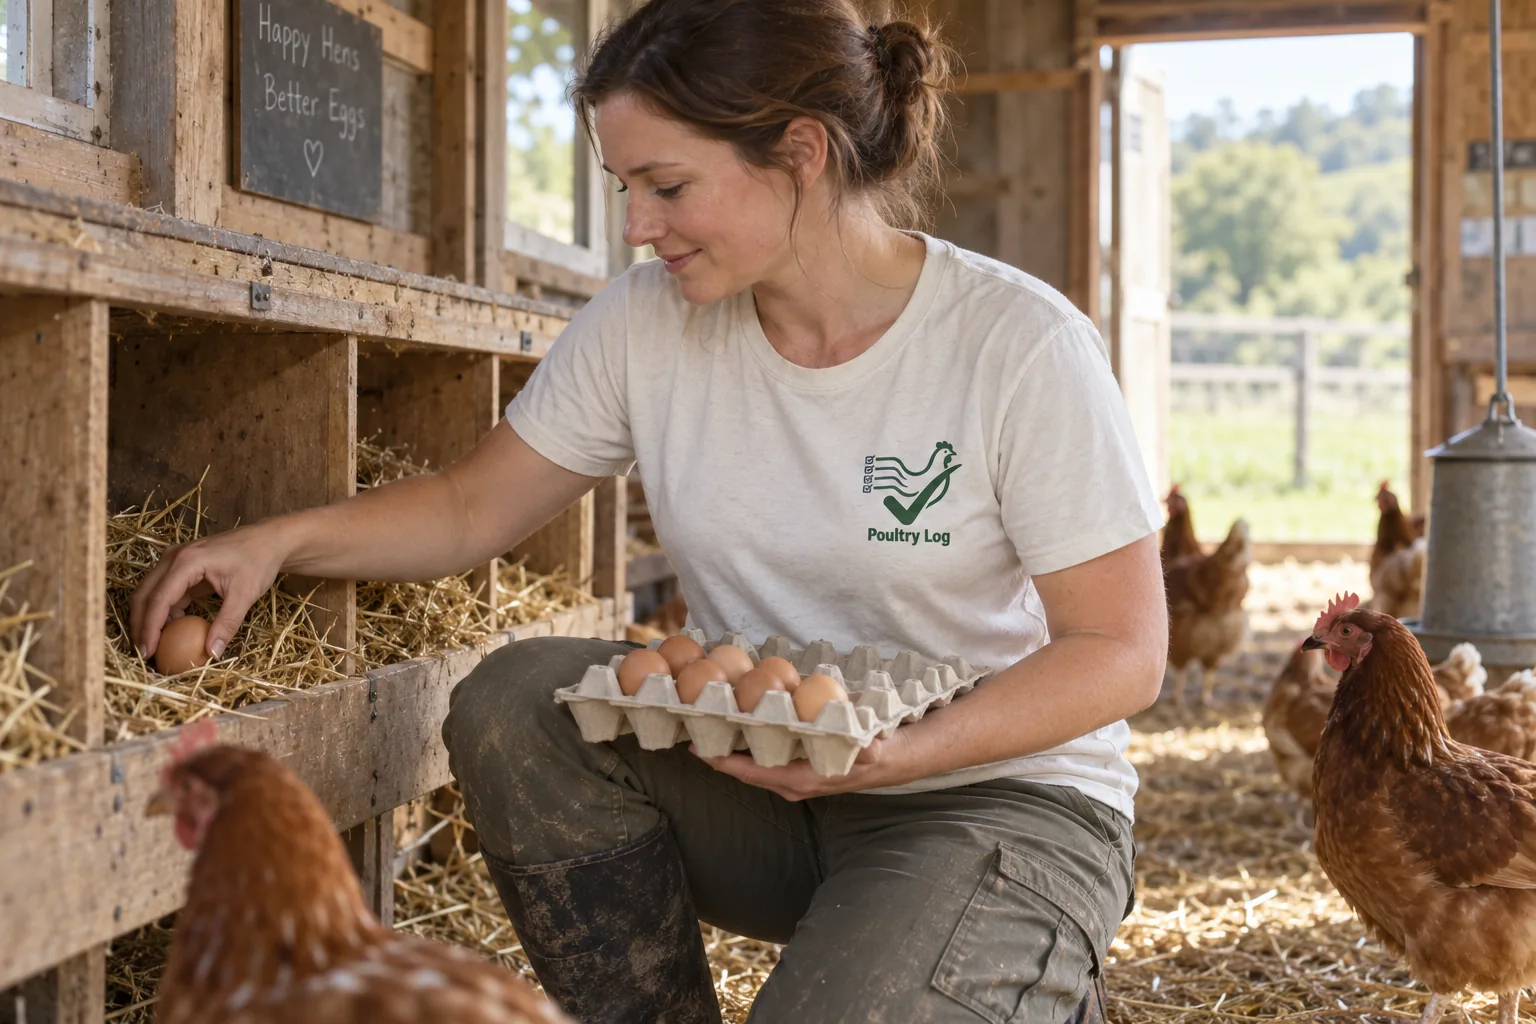
Turkey growing runs on a different clock than broilers: cycles stretch to 14–20+ weeks depending on the target, weight curves follow their own trajectory, and mortality sensitivity peaks at moments broiler schedules never see. Software tuned for a 42-day broiler cycle misreads all of it — "behind target" alerts fire against the wrong curve, and cost-per-bird math lands on the wrong day. This page covers what turkey-growing software demands, what to verify in any tool, and an honest note on where commercial-broiler tools like PoultryLog™ fit — and where they do not.
What Does Turkey-Growing Software Demand?
| Demand | Why Turkeys Specifically | What to Verify in Any App |
|---|---|---|
| Turkey-specific growth curves | Tom and hen targets diverge sharply through the cycle, and the whole curve runs longer than broilers — comparisons against broiler curves mislabel every week | Ask which turkey strains and sex the app's reference curves cover; verify directly with the vendor |
| Long-cycle cost tracking | Feed across 16+ weeks compounds differently than a 42-day broiler cycle — cost per bird at week 12 means something different than at week 4 | Record feed across a long window; check cost-per-bird trends compute by week, not just at catch |
| Mortality sensitivity windows | Turkey flocks have well-documented vulnerability windows (early poult losses, weather transitions) that demand closer monitoring than broiler schedules assume | Confirm alerts can compare against your own weekly baseline, not just static targets |
| Sex-separate or mixed flock handling | Many turkey operations run sex-separated flocks — the tool must hold separate records without forcing them into one blended view | Set up a tom flock and a hen flock in the demo; check both keep their own curves |
| Processing-timeline flexibility | Turkey processing windows and weight targets vary more by contract than broiler catch windows | Check whether the app handles flexible target weights without assuming a catch date |
What to Verify Before You Commit
- Ask the turkey question directly: does the vendor support turkeys today, with turkey reference curves, and can you see it in a demo? Species support on a marketing page and in the product are different things — verify with the vendor, not the brochure.
- Run the long-cycle drill: model a 16-week turkey flock and check the app does not force broiler-phase assumptions (starter/grower/finisher at broiler timing) onto the schedule.
- Check the sex-separation question: tom and hen flocks need separate curves — an app that blends them produces averages that describe no bird in the house.
- Verify export and ownership: the non-negotiable at any scale — see the buyer's guide data-portability criterion.
Where PoultryLog™ Fits — and Where It Does Not
PoultryLog™ is built for commercial broiler operations — its breeder-curve comparisons (Cobb 500 and Ross 308), phase-based growth tracking, and settlement workflows assume broiler houses and the broiler cycle. For turkey growers, the honest recommendation is to evaluate tools that support turkeys natively against the criteria above, verifying species support directly with each vendor. The buyer's guide segmentation table shows how to run that evaluation — the nine-criterion checklist applies to turkeys as much as broilers, even when the tool that passes it is not PoultryLog™. If your operation also runs broiler flocks, the same guide explains how a grower evaluates tools for both species without forcing either into the wrong mold.
Where the Money Shows Up
Turkey economics concentrate in two places: the long feed bill (16+ weeks of consumption before a single dollar returns) and the mortality windows (early poult losses and weather transitions that punish late recognition). Records that track weekly feed against the right curve are what catch a conversion drift at week 8 instead of at settlement — the same principle the feed consumption chart applies at broiler scale, with your turkey curve. And mortality patterns read the same way at any scale: the timestamped log is what turns "losses happened" into "losses clustered after the cold night" — see the cause-signature table for the method.
- Poultry management software buyer's guide — parent evaluation framework with segment table.
- Common broiler mortality causes — the cause-reading method, adaptable to any poultry species.
- Best free poultry app — what free tiers actually include.
- 2026-10-05: Comprehensive rewrite. Segment demand table, species-verification method, and honest scale positioning — replacing the earlier self-ranking version with unverified species-capability claims.
- Earlier version: "best app" ranking with unverified competitor claims.