
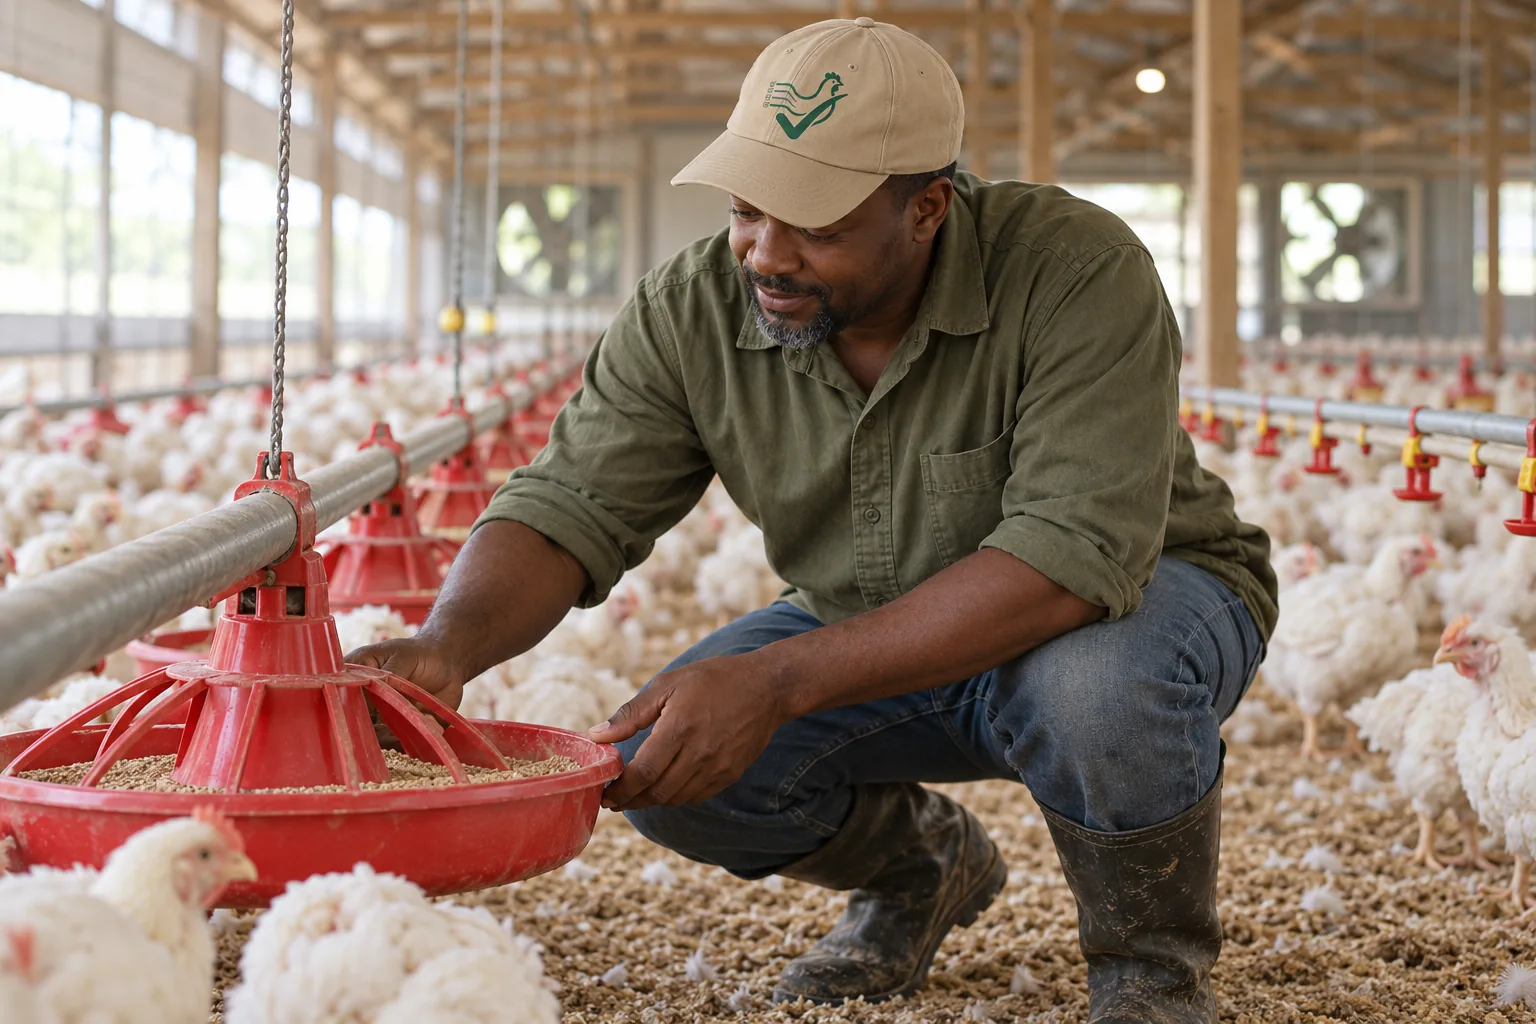
Why Feed Cost Tracking Changes Your Margin
Feed is the single largest expense on any poultry operation. Every grower knows this, but few track feed cost with the precision it demands. A one-cent-per-pound difference in feed price across 200,000 birds means $2,000 that either stays in your pocket or disappears into the bin.
Tracking feed cost is not just about knowing what you spent. It is about knowing when the spending changed, whether the change was expected, and what it did to your margin. The growers who catch a feed cost overrun in week two, not at settlement, are the ones who keep their profit.
The Three Things That Make Feed Cost Go Wrong
Feed cost overruns come from three sources: the price you pay, the amount you use, and the efficiency with which birds convert it. Each is trackable, but each requires different data.
Price drift happens when feed contract prices change between placements, or when a new ration costs more than the last one. Logging feed price per ton for each delivery catches this early.
Volume creep happens when birds eat more than projected. Overfeeding, feed wastage from damaged equipment, and spilled feed all increase the pounds of feed consumed per bird. Comparing actual feed use against the growth chart target reveals this quickly.
FCR degradation means birds are converting feed to body weight less efficiently than expected. A 0.01 FCR increase on a 200,000-bird flock adds roughly $2,000 to $3,000 in feed cost at current prices. FCR drift shows up first in the weekly feed-use-per-bird number.
What to Log and When
Log every feed delivery: date, quantity, price, and ration type. Log the feed consumed per bird weekly using the growth chart baseline. Compare the actual feed-per-bird number against the breed's published target for that age.
Poultry Log™ tracks feed by flock and house, so you can see which house is consuming more than expected. When a delivery ticket arrives, log the ration, weight, and cost. When the weekly feed number arrives, compare it to the previous flock and to the breed target.
Spotting the Overrun
An overrun is not a crisis — it is information. The question is whether it is a one-time spike or a trend.
- One-time spike: Check the delivery ticket for weight accuracy, the ration for formula errors, and the feeder equipment for wastage.
- Trend upward: Compare across flocks. If feed cost per bird has increased three or more flocks in a row, the cause is systemic — feed conversion, bird health, or equipment degradation.
- House comparison: If one house consumes significantly more feed per bird than another, the problem is house-specific — ventilation, drinker function, or feeder settings.
Connecting Feed Cost to Profit
Feed cost per bird is one component of total cost per bird. When you track it alongside mortality, weight, and settlement, the full margin picture appears. A flock with excellent FCR but high feed price can still lose money. A flock with mediocre FCR but low feed cost and good weight can still profit.
Poultry Log™ connects these dots automatically when you log feed deliveries and weights by flock and house. The trend view shows feed cost per bird over time, making it easy to spot whether cost changes are driven by price, volume, or conversion.