
Four houses, two well groups, three flock cycles
Horsebranch Farms is a four-house poultry farm in South Carolina. During this pilot, the grower used PoultryLog™ to record water-meter readings, additive use and operational notes across three completed flock cycles. Houses 1 and 2 shared one well; houses 3 and 4 shared another. The farm permitted publication of its name and these aggregate observations.
This is a PoultryLog™-authored record review, not an independent trial or customer testimonial. The grower confirmed that the entries were cumulative meter readings, that meters were reset, and that some recording days were missed. The third cycle started August 3, 2026; that clarification was applied to this analysis without changing the account.
What the recorded intervals showed
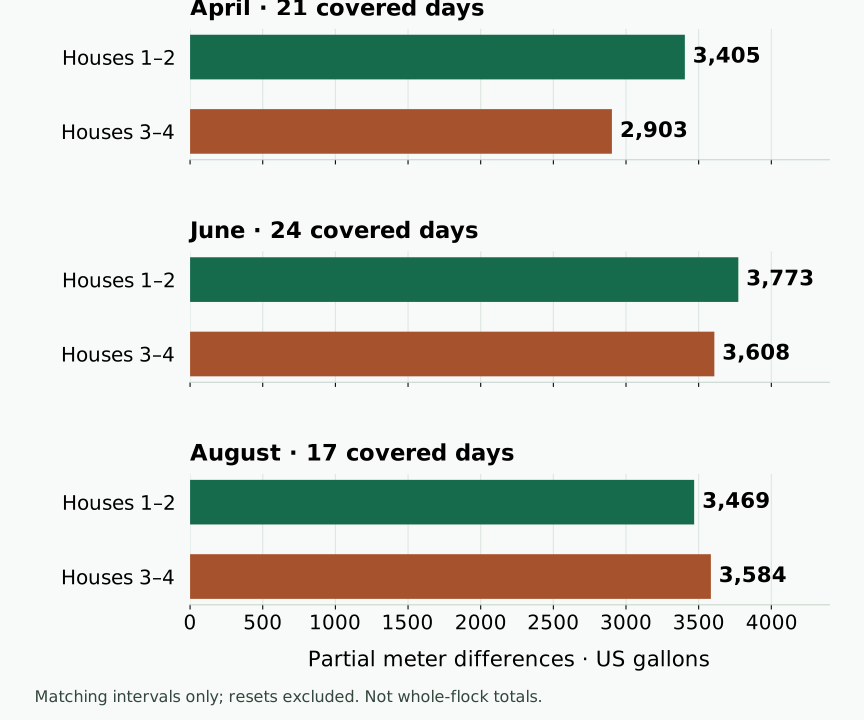
The figures below sum meter increases over matching intervals for all four houses. They cover only part of each flock. A gap between readings can still contribute an interval difference; a reset cannot be bridged without its missing readings.
| Cycle | Covered days | Houses 1–2 | Houses 3–4 |
|---|---|---|---|
| April | 21 | 3,405 | 2,903 |
| June | 24 | 3,773 | 3,608 |
| August | 17 | 3,469 | 3,584 |
Houses 1–2 had larger recorded increases in the April and June samples; houses 3–4 had slightly larger increases in the August sample. The pattern changed between cycles. This identifies a comparison to investigate, not a finding that one well or additive was better.
April placed 53,000 birds in houses 1–2 and 52,000 in houses 3–4. June and August placed 54,000 in each group. Bird counts, flock age, measurement timing, missing periods and operational conditions affect comparisons. Different covered periods mean the table should not be read as a trend in whole-flock consumption.
How we handled cumulative readings
- Use the difference between a later and earlier cumulative reading, rather than adding the meter readings.
- Choose endpoint dates with one entry in each of the four houses. Exclude repeated-entry endpoint dates instead of guessing which entry replaces another.
- Inspect intervening records. If any house has a decrease, exclude that entire shared interval from both well groups. Treat it as a reset or correction boundary, not negative or zero usage.
- Sum the remaining interval differences separately for each house and well group. Missing days are not filled with zero.
The April sample contains 17 accepted intervals spanning 21 calendar days; June has 23 spanning 24 days; August has 15 spanning 17 days. Four, five and eight candidate intervals respectively were excluded because a house reading decreased. These exclusions can bias the sample: the retained intervals do not represent every day of a flock. Undocumented resets between readings also remain a limitation.
Stored quantities were converted from liters to US gallons using 3.785411784 liters per gallon. This separate analysis does not validate historical dashboard consumption totals or alerts. For routine consumption logging, calculate the amount used between meter readings before entering it as consumption.
Inspect the aggregate figures and calculation method. Raw account records, contact details and private documents are not included in this download.
Additive records provide context
The records include additive names, mixing-rate entries and operational notes. Those entries help a grower revisit what was recorded alongside a water change. They do not establish the delivered dose throughout an interval, and this pilot was not a randomized additive experiment. No additive recommendation or treatment effect is claimed.
What a grower can do next
Record readings at a consistent time. Note resets with the readings immediately before and after them, distinguish a cumulative register from interval consumption, and record interruptions that may affect interpretation. Compare houses over the same intervals before investigating water supply, delivery equipment or management differences.
The demonstrated value is an organized record for comparison and follow-up. Water records can support operational decisions, but this case study makes no claim of improved final weight, APC, profit or reduced costs. Those outcomes were not verified for publication.
Review PoultryLog™’s commercial broiler workflows and limitations, or use the grower budget calculator to separate costs you actually pay from integrator-paid inputs.
Source and review
Published October 12, 2026. Samuel Howell, PoultryLog™ product maintainer, reviewed authorized Horsebranch account records read-only. The farm description, well grouping, cumulative-reading interpretation, reset history and August start-date clarification were supplied by the pilot organizer. No farm records were changed. This review has not received independent poultry-scientist validation.